Ultimate Guide to Transportation Metrics for 3PL

Transportation metrics are the backbone of efficient logistics. For 3PL providers, these metrics ensure goods move seamlessly, costs stay controlled, and customers remain satisfied. Key metrics like on-time delivery, cost per unit shipped, and order accuracy directly impact performance, profitability, and client trust.
Here’s what you need to know:
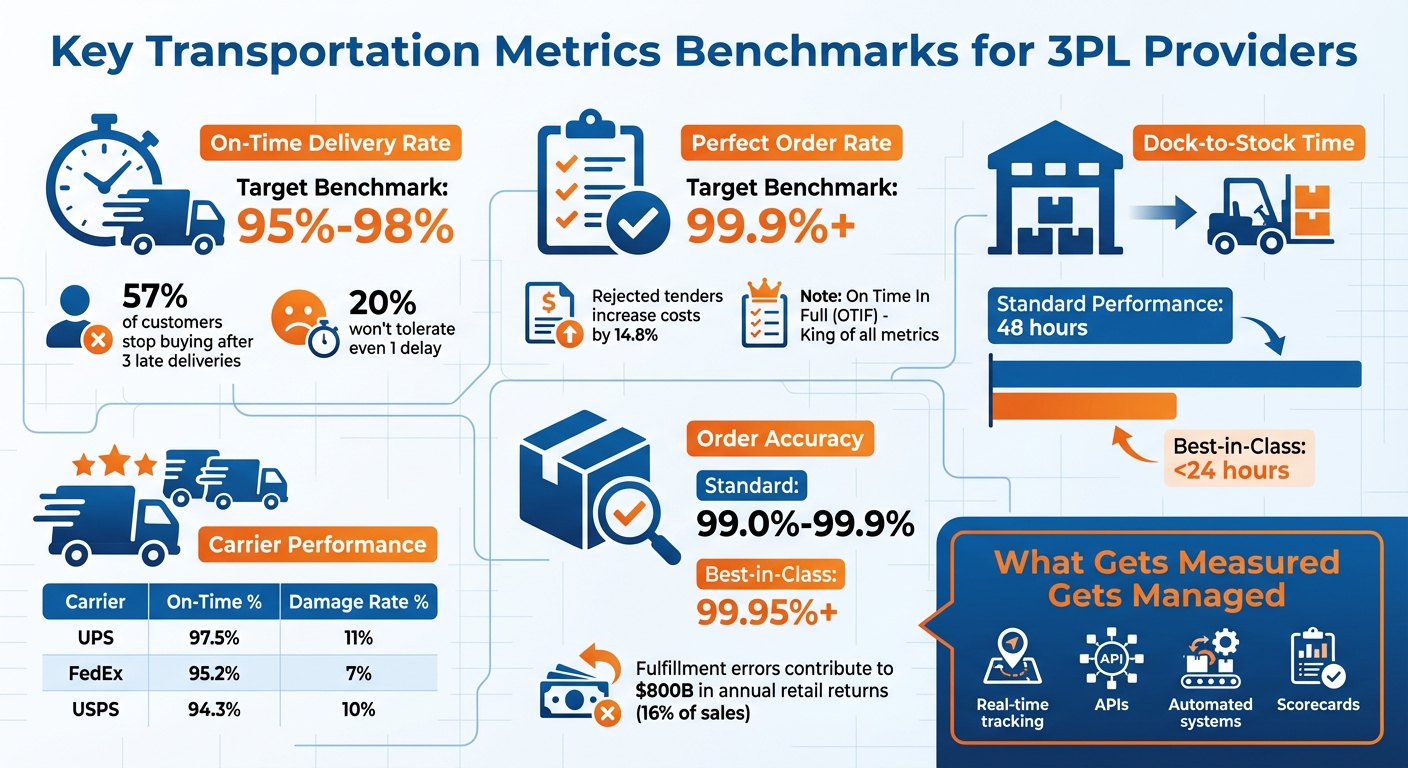
- On-Time Delivery Rate: Aim for 95%-98%. Late deliveries drive customers away - 57% won’t return after three delays.
- Cost Per Unit Shipped: Lowering costs through strategies like shipment consolidation improves efficiency.
- Perfect Order Rate: High standards (99.9%) avoid costly errors and build loyalty.
- Dock-to-Stock Time: Faster turnaround (<24 hours) increases inventory availability and throughput.
- Carrier Performance: Reliable carriers with high on-time pickup and transit accuracy are critical.
Why it matters: Metrics create accountability, improve processes, and align 3PLs with client goals. Using tools like real-time tracking, APIs, and scorecards ensures continuous improvement and measurable success.
Key Transportation Metrics Benchmarks for 3PL Providers
How To Build Logistics Dashboard in Excel | Step By Step Excel Tutorial | Logistics KPI Dashboard
sbb-itb-eafa320
Core Transportation Metrics for 3PL Providers
These key metrics help measure how well third-party logistics (3PL) providers meet customer expectations while keeping costs in check.
On-Time Delivery Rate
This metric reflects the percentage of shipments that reach their destination within the promised timeframe. It's calculated using the formula: (On-Time Deliveries / Total Deliveries) × 100. Top-performing 3PLs aim for on-time delivery rates between 95% and 98%. Why does this matter? Because 57% of customers stop buying from retailers after three late deliveries, and 20% won't tolerate even one delay.
However, defining "on-time" can be tricky. Without clear agreements, disputes between shippers and carriers are common. To avoid misunderstandings, service agreements should specify a one-hour delivery window. Another challenge is visibility - 36% of retailers struggle with on-time delivery due to a lack of real-time order tracking.
Cost Per Unit Shipped
Sometimes called Freight Cost Per Unit, this metric is calculated as Total Shipping Costs ÷ Total Units Shipped. It includes all shipping-related expenses, from packaging and labor to fuel surcharges and accessorial fees. Ideally, this cost should decrease as order volumes rise, thanks to economies of scale.
Reducing this cost often requires smart strategies like negotiating better carrier rates, leveraging volume discounts, and consolidating shipments to fill trailer space more efficiently.
"Consolidation strategies can reduce landed costs per unit by double-digit percentages." - Andrew Lynch, President of Zipline Logistics
Perfect Order Rate
This metric evaluates how many orders are delivered on time, in full, undamaged, and with accurate documentation. The formula is (Perfect Orders / Total Orders) × 100.
"On Time In Full (OTIF) metric is the king of all metrics for retail and consumer packaged goods segments." - Andrew Lynch
Maintaining a high Perfect Order Rate often depends on tools like automated verification systems, barcode scanning, and real-time tracking, which help catch errors before they impact the customer experience. Failing to meet these standards can have financial consequences - rejected tenders, for instance, can increase the cost of moving loads by an average of 14.8%.
Operational Efficiency Metrics
Operational efficiency metrics are all about gauging how well warehouses and transportation systems are running. These metrics dive into the nitty-gritty of processes, focusing on how smoothly things flow and how they impact overall performance and service quality.
Dock-to-Stock Time
This metric measures the time it takes for products to move from the moment they arrive at the warehouse yard to being stored and logged into the inventory system. The receiving dock is often a major bottleneck - delays here can lead to higher costs across the board.
The faster this process, the quicker products become available for use or sale. While the average dock-to-stock time hovers around 48 hours, top-performing operations can get it done in under 24 hours. Streamlining this process not only reduces delays but also increases the overall throughput of the warehouse.
On the flip side, long dwell times - when carriers sit idle waiting to be processed - can signal problems like poor scheduling or staffing shortages. These delays make it harder for shippers to attract carriers and may lead to higher costs for securing capacity. To tackle this, automated dock scheduling systems can help reduce yard congestion and ensure teams are ready for incoming shipments. Tracking carrier wait times can also help cut detention fees and save valuable labor hours.
"The warehouse receiving dock emerges as a critical control point. It's the gateway for all inbound goods, and any inefficiencies here – congestion, delays, miscommunication – can create significant downstream disruptions and escalate costs."
– QueueMe
Next, let’s explore order processing metrics and how they tie into operational efficiency.
Order Accuracy and Fulfillment Cycle Time
Order accuracy reflects the percentage of orders processed without errors, while fulfillment cycle time measures the speed from order receipt to shipment. Leading third-party logistics providers (3PLs) often boast order accuracy rates above 99.9%, with some nearing an impressive 99.993% across various processes like inbound, inventory management, and shipping. Many top providers also aim to process orders within 24 hours, with about 53% managing to do so in under an hour.
These metrics have a direct impact on profitability. For instance, fulfillment errors contribute significantly to retail returns, which account for over 16% of sales - amounting to roughly $800 billion annually. Using tools like barcode scanners, automated picking systems, and Warehouse Management Systems (WMS) can help streamline operations and minimize human error. Automated checks at packing stations can catch mistakes before shipments leave, and WMS data can optimize picking routes to save time for warehouse staff.
Regular cycle counts are another way to maintain high inventory accuracy without the hassle of year-end audits. High-performing warehouses often achieve inventory accuracy rates of 99% or more by leveraging real-time tracking through RFID or automated updates. Some facilities even use real-time LCD displays to show productivity metrics, such as units picked or packed per hour, encouraging friendly competition and boosting efficiency.
| Metric | Standard Performance | Best-in-Class Performance |
|---|---|---|
| Dock-to-Stock Time | 48 Hours | < 24 Hours |
| Order Accuracy | 99.0% - 99.9% | 99.95%+ |
| Inventory Accuracy | 98.0% | 99.5% - 99.9% |
| Order Processing Time | 1-2 Hours | < 1 Hour |
Carrier Performance Metrics
Carrier performance metrics help assess carrier reliability and guide informed decision-making.
On-Time Pickup Rate
This metric tracks the percentage of pickups completed within the scheduled time frame. It’s calculated by dividing the number of on-time arrivals by the total scheduled pickups. The definition of "on-time" can vary based on the Service Level Agreement (SLA) - some companies use a 15-minute window, while others allow up to an hour.
Generally, a performance rate of 90% or higher is considered acceptable, but anything below 95% often triggers discussions about corrective actions.
"Failures to communicate proactively are often more impactful issues than the late pickup or delivery itself".
Weekly scorecards are a practical way to measure performance consistently, fostering ongoing conversations and avoiding surprises during formal reviews.
Transit Time Accuracy
Transit time accuracy evaluates how closely actual delivery times align with promised schedules. During the 2022 holiday season, benchmarks were set at 97.5% for UPS, 95.2% for FedEx, and 94.3% for USPS. Falling below 98% for on-time final deliveries often signals the need for an operational review.
Inaccurate transit times can have costly consequences. A study by MIT graduate student Yoo Joon Kim revealed an average tender rejection rate of 19.8%. Rejected tenders increased the final cost of moving a load by 14.8% on average, which translated to a 2.8% rise in overall transportation expenses for shippers.
Technology plays a key role in improving transit accuracy. Switching from traditional EDI to APIs allows for more frequent updates and faster communication. Tools like route optimization software and machine learning help pinpoint delay causes, whether related to travel distance, driver shortages, or specific lane challenges .
Damage-Free Delivery Rate
This metric measures the percentage of shipments delivered without damage or loss. In the U.S., damaged shipments result in about $1 billion in annual losses. Reported damage rates show UPS at 11%, USPS at 10%, and FedEx at 7%. Additionally, 13% of customers say they wouldn’t order from a retailer again if a package arrived damaged.
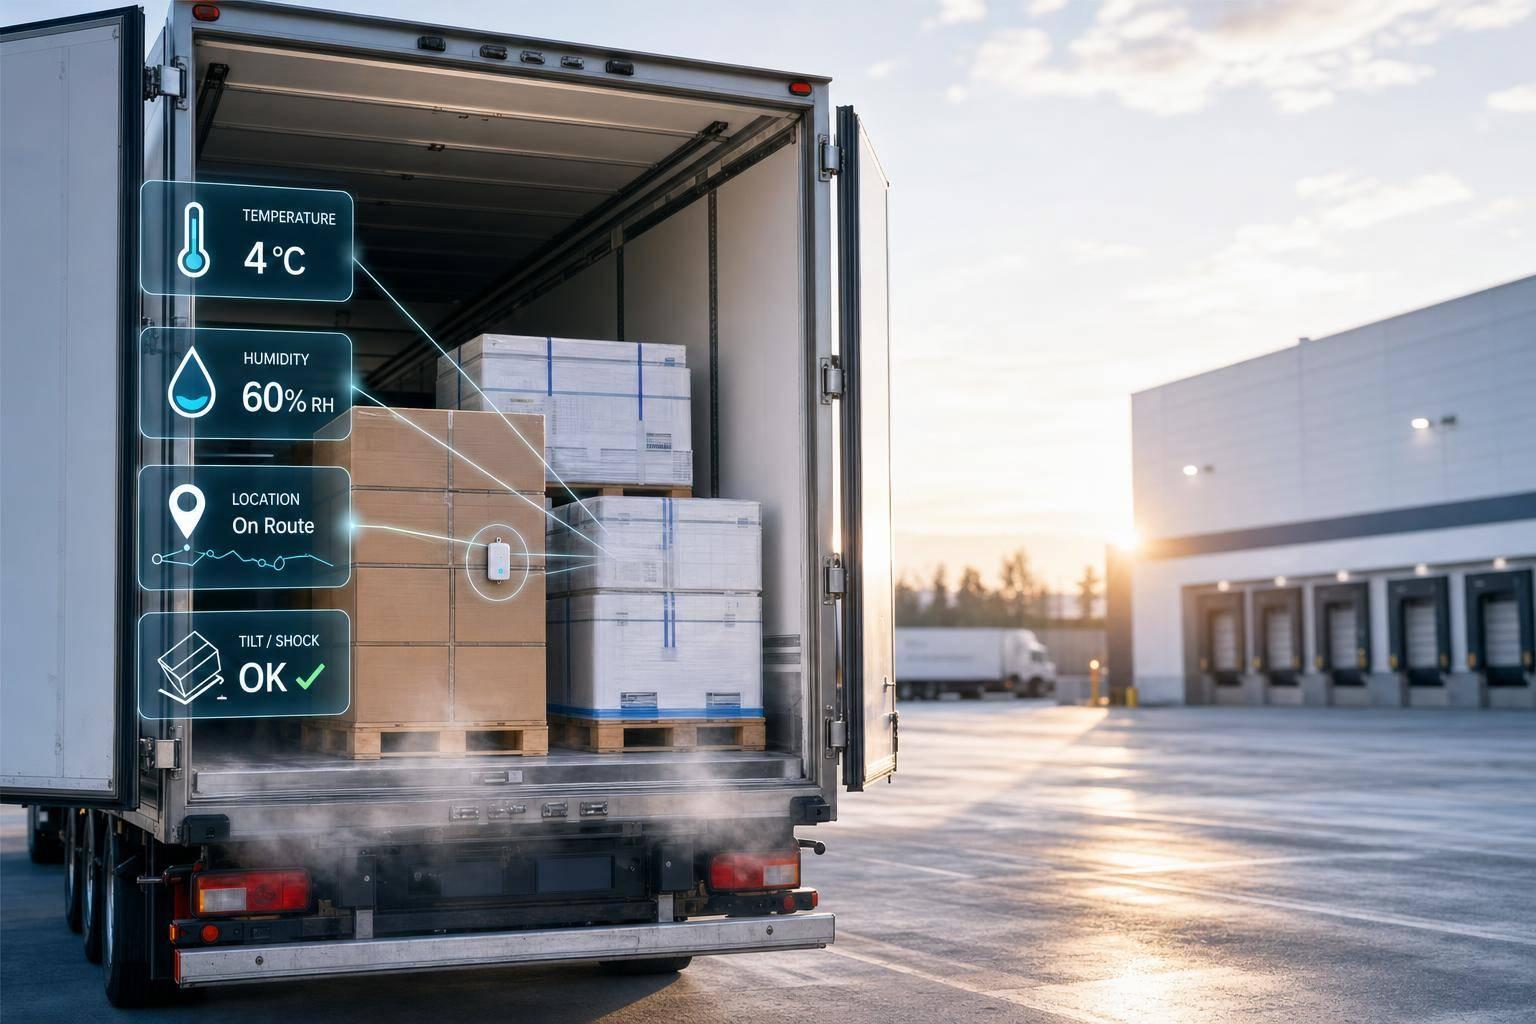
Advancements in packaging and technology are reducing these risks. Some third-party logistics providers (3PLs) use "FreightCams" to capture images of shipments before departure and upon arrival, providing clear evidence for claims. Pallet-level tracking devices monitor conditions like temperature, vibration, and shock in real time, helping to address issues before they escalate. For shipments involving multiple modes of transport, tracking damage rates at transfer points is especially critical, as risks increase with each handoff.
| Carrier | On-Time Performance (2022 Holiday) | Damage Rate |
|---|---|---|
| UPS | 97.5% | 11% |
| FedEx | 95.2% | 7% |
| USPS | 94.3% | 10% |
These metrics form the backbone of integrating performance data into SLAs and reporting systems, ensuring transparency and accountability.
Integrating Metrics into SLAs and Reporting
Transportation metrics are only effective when they’re seamlessly integrated into service-level agreements (SLAs) and reporting systems. Without clear definitions in contracts and real-time visibility, even the most insightful metrics become just numbers on a spreadsheet. By aligning these metrics with specific business goals, they can evolve from raw data into actionable SLAs.
Selecting Metrics That Match Business Goals
Not every metric carries the same weight for every client. The trick lies in selecting key performance indicators (KPIs) that align with the client’s priorities rather than tracking every possible data point. This alignment should be established early in the process, clearly outlined in the Statement of Work (SOW) and service agreement.
For clients aiming to cut costs, focus on metrics like cost per order, trailer utilization, and billing accuracy. If customer satisfaction is the priority, emphasize metrics such as on-time delivery, order accuracy rate, and damage-free delivery. Meanwhile, speed-driven operations should track order cycle time, dock-to-stock time, and on-time pickup rates.
Clearly defined KPIs within SLAs ensure everyone is on the same page. For instance, on-time performance rates below 95% often require corrective action, while a healthy tender acceptance rate typically falls between 85% and 95%. Shippers should also specify detailed performance expectations in their carrier guides, such as 98% on-time delivery or 100% EDI compliance. It’s equally important to define what "on-time" means - perhaps within a one-hour window of the scheduled appointment. For specialized shipments, such as pharmaceuticals, agreements should include metrics for regulatory compliance and temperature monitoring.
Scorecards, updated weekly or monthly, offer a measurable way to track the success of these relationships and help avoid surprises during formal reviews.
"Scorecards provide a quantifiable way to measure the success of the relationship between the parties." – Ken Sherman, Vice President and General Manager at IntelliTrans.
SLAs should also outline remediation protocols, such as root cause analysis or process adjustments, for when performance falls short. This approach not only clarifies expectations but also fosters continuous improvement through feedback loops.
Setting Up Reporting Systems
Once the right KPIs are chosen, a robust reporting system is essential for real-time monitoring. Modern systems have moved beyond traditional Electronic Data Interchange (EDI) to Application Programming Interfaces (APIs), which enable faster and more frequent updates from carrier systems. Advanced platforms now integrate data from TMS, WMS, and ERP systems, with updates as frequent as hourly. Cloud-based TMS platforms serve as a "single source of truth", allowing shippers to manage the entire shipment lifecycle - from rating and tracking to managing operations - within a single interface.
To ensure reliable analytics, audit carrier data for accuracy and completeness before generating reports. Dashboards should be tailored to specific needs: operational dashboards for daily tasks, strategic dashboards for long-term goals, and analytical dashboards for identifying trends and root causes. For example, bar charts showing truck fill levels by volume and weight can provide immediate insights.
Focusing on 10–20 key metrics prevents data overload and keeps teams focused on what matters most. Instead of waiting for quarterly reviews, automated scorecards sent weekly can maintain an ongoing dialogue about performance.
"Data helps shippers quickly identify opportunities, and allows them to react to them faster than ever before." – Todd Holt, President of Transportation at NFI.
Operational dashboards should include direct links to outstanding tasks, reminders, and detailed lists to enable quick action. Systems should also allow users to drill down into underperforming KPIs by product line, origin, lane, or customer to pinpoint specific issues. Real-time tracking technology has become cost-effective enough to monitor individual pallets for factors like temperature, vibration, and shock. Additionally, there’s a growing focus on tracking metrics related to sustainability, such as CO₂ savings and reduced empty miles. This commitment to accountability and real-time visibility underscores the importance of using transportation metrics to optimize performance.
Using Metrics for Continuous Improvement
Metrics are only as valuable as the actions they inspire. Simply archiving performance data won’t drive progress. Instead, these metrics should be used to spark operational changes, identify weaknesses, and leverage technology to bridge gaps.
Comparing Performance to Industry Standards
Benchmarking your performance against industry standards helps you understand where you stand and reveals opportunities for improvement. For example, top-performing third-party logistics providers (3PLs) aim for a 99.9% order accuracy rate and strive to keep on-time delivery rates above 95%. Falling short of these benchmarks can have a steep financial cost. For instance, repeated tender rejections can increase overall transportation spending by 2.8% over five years.
To make benchmarking effective, it should be a regular process - quarterly or even monthly - not just an annual task. Digging into specific data points like product lines, shipping origins, lanes, and customer profiles can help pinpoint problem areas. Metrics such as out-of-network shipments or trailer utilization can reveal opportunities for shipment consolidation, which can significantly cut costs.
Carrier scorecards are another essential tool. These provide a clear, quantifiable way to evaluate performance. Weekly performance updates, rather than waiting for quarterly reviews, keep the conversation ongoing and avoid surprises. Additionally, third-party tools like DAT RateView or Cass Information Systems allow you to compare your internal contract rates with real-time spot market data, ensuring decisions are based on up-to-date information.
The stakes are high when it comes to customer satisfaction. A staggering 57% of customers will stop returning after three late deliveries, and 1 in 5 consumers won’t forgive even a single delay. These numbers highlight why continuous improvement isn’t optional - it’s essential for maintaining customer loyalty and avoiding costly penalties.
Once benchmarks are established, the next step is using technology to turn insights into actionable improvements.
Applying Technology and Network Resources
Identifying performance gaps is just the beginning. The real challenge lies in using technology to close those gaps. Modern Transportation Management Systems (TMS) now integrate APIs, business intelligence (BI) tools, and real-time tracking to turn raw data into actionable insights. APIs are quickly replacing traditional EDI systems, offering more frequent and real-time updates directly from carriers. BI tools, on the other hand, transform data into daily analytics and easy-to-read scorecards.
Machine learning adds another layer of efficiency by analyzing historical data to identify patterns behind late deliveries. It can even automate dispatching, selecting the closest driver for on-demand orders - an approach that often outperforms manual methods. Real-time tracking tools, such as GPS devices and freight cameras, also play a crucial role. They monitor cargo conditions before and after transit, reducing claims and improving overall security.
"Data helps shippers quickly identify opportunities, and allows them to react to them faster than ever before." – Todd Holt, President of Transportation, NFI
Many businesses still struggle with visibility - 36% of retailers cite a lack of real-time order tracking as a major challenge. Integrating systems like Order Management Systems (OMS), TMS, Warehouse Management Systems (WMS), and driver apps into a single platform can eliminate these blind spots. Automated systems can flag delivery exceptions in real time, allowing for immediate corrective actions instead of delays that surface days later.
For companies like JIT Transportation, combining advanced technology with a scalable network enables quick responses and steady performance improvements. A strong network also supports collaborative shipping strategies, such as pairing customers for roundtrips to reduce empty miles and minimize waste. By leveraging real-time data and analytics, transportation metrics evolve from passive indicators into active tools for optimization.
Regular data audits are critical to ensure the accuracy of these insights. With high-quality data, advanced technology, and a robust network, logistics providers can consistently meet benchmarks like dock-to-stock times under 24 hours and invoice accuracy rates above 95%.
Conclusion
Tracking transportation metrics is the backbone of smarter decision-making, cost efficiency, and improved customer experiences. Without reliable data, 3PL providers are left guessing instead of making informed choices. As Peter Drucker famously said, "What gets measured gets managed" - a principle that is especially relevant here.
Critical benchmarks like 99.9% order accuracy, over 95% on-time delivery, and dock-to-stock times under 24 hours are non-negotiable for success. Achieving these standards demands the right mix of technology, streamlined processes, and strong partnerships. Tools like advanced warehouse management systems, real-time tracking, and automated alerts turn raw data into actionable insights.
"Eighty-five percent of the reasons for failure are deficiencies in the systems and process rather than the employee. The role of management is to change the process rather than badgering individuals to do better." – Dr. W. Edwards Deming
This quote underscores the importance of focusing on refining systems rather than placing blame. Metrics should guide collaborative problem-solving between shippers and 3PL providers, fostering continuous improvement. This approach is at the heart of the integrated solutions we provide.
JIT Transportation combines cutting-edge technology with a nationwide network to deliver tailored 3PL solutions. From ERP integration to specialized services like white glove handling, we ensure your critical KPIs are consistently met.
Operational excellence starts with measuring the right metrics, benchmarking results, and using technology to close performance gaps. By acting on these insights, 3PL providers move from being reactive to proactive, building trust and driving sustainable growth.
FAQs
What steps can 3PL providers take to improve on-time delivery performance?
To improve on-time delivery rates, 3PL providers need to keep a close eye on their On-Time Delivery KPI. This helps spot patterns and pinpoint areas that need attention. Managing delivery schedules becomes even more critical during peak demand periods, where precision is key. Fine-tuning carrier routes and syncing schedules with promised delivery windows are practical steps to consistently meet customer expectations.
Leveraging advanced technology for real-time shipment tracking can make a big difference. It allows for quick responses to potential delays, boosting reliability. Additionally, maintaining clear communication with both carriers and customers ensures everyone is on the same page, minimizing the chances of missed deadlines.
How can 3PL providers lower their cost per unit shipped?
Lowering the cost per unit shipped is a top priority for 3PL providers looking to remain competitive in the U.S. market. To start, track this metric alongside other key indicators like order accuracy, on-time delivery, and cost per mile. This will help pinpoint inefficiencies and establish a baseline for improvement.
One effective approach is to maximize load density. By combining shipments and fully utilizing trailer space, you can cut fuel expenses and bring down the cost per mile. Consolidating shipments and leveraging cross-docking techniques can also reduce handling time and warehouse labor costs. On top of that, these methods can strengthen your position when negotiating carrier rates. Regularly reviewing carrier contracts for volume discounts and using a combination of transportation modes - like LTL (less-than-truckload) and FTL (full truckload) - ensures you’re aligning shipment sizes with the most economical options.
Improving order accuracy is another way to save. Fewer errors mean fewer returns and re-shipments, which can quickly add up in costs. Using real-time analytics and other data-driven tools allows you to uncover hidden cost drivers and address them proactively. By blending these strategies, 3PL providers can effectively lower shipping expenses while maintaining high service standards.
Why is it important for 3PLs to include transportation metrics in their SLAs?
Including transportation metrics in Service Level Agreements (SLAs) plays a key role in setting clear expectations, holding all parties accountable, and aligning the performance of third-party logistics (3PL) providers with your business objectives. These metrics act as measurable benchmarks, helping you track efficiency, pinpoint areas that need attention, and maintain open communication between everyone involved.
By weaving transportation metrics into SLAs, businesses can keep a close eye on performance, tackle potential problems early on, and encourage ongoing improvements in supply chain operations. This not only supports smarter decision-making but also boosts the reliability of services overall.
Related Blog Posts
Related Articles
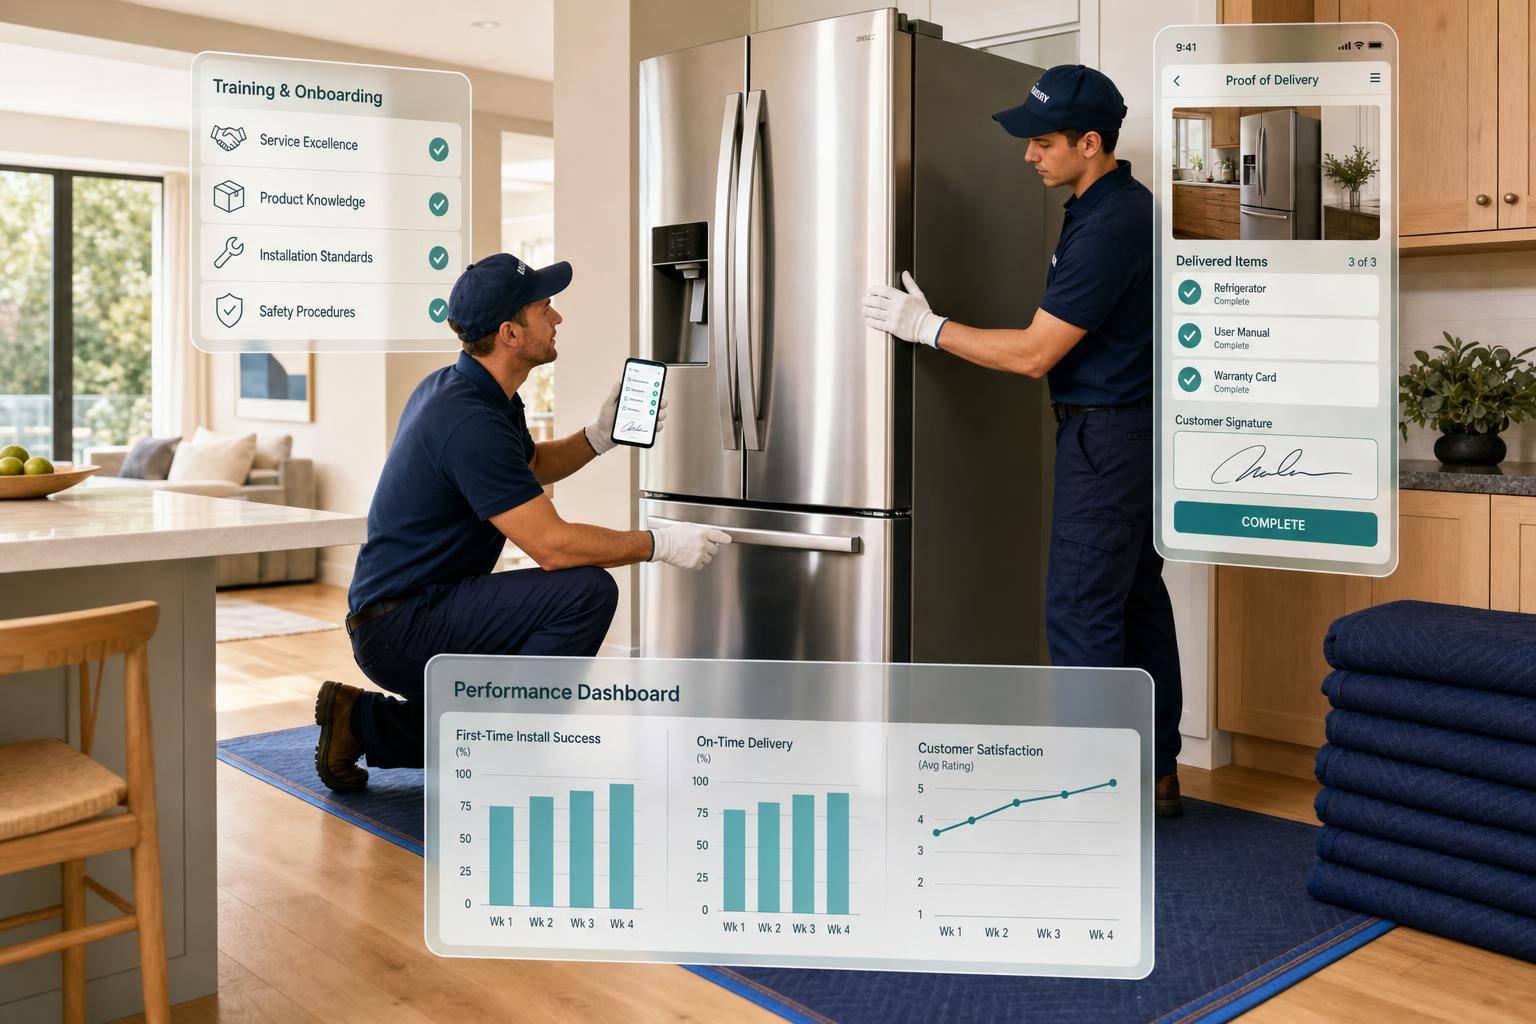
How 3PLs Train White Glove Delivery Teams

Ultimate Guide to Automation Change Management