
7 3PL Peak Season Planning Tips for DTC Brands
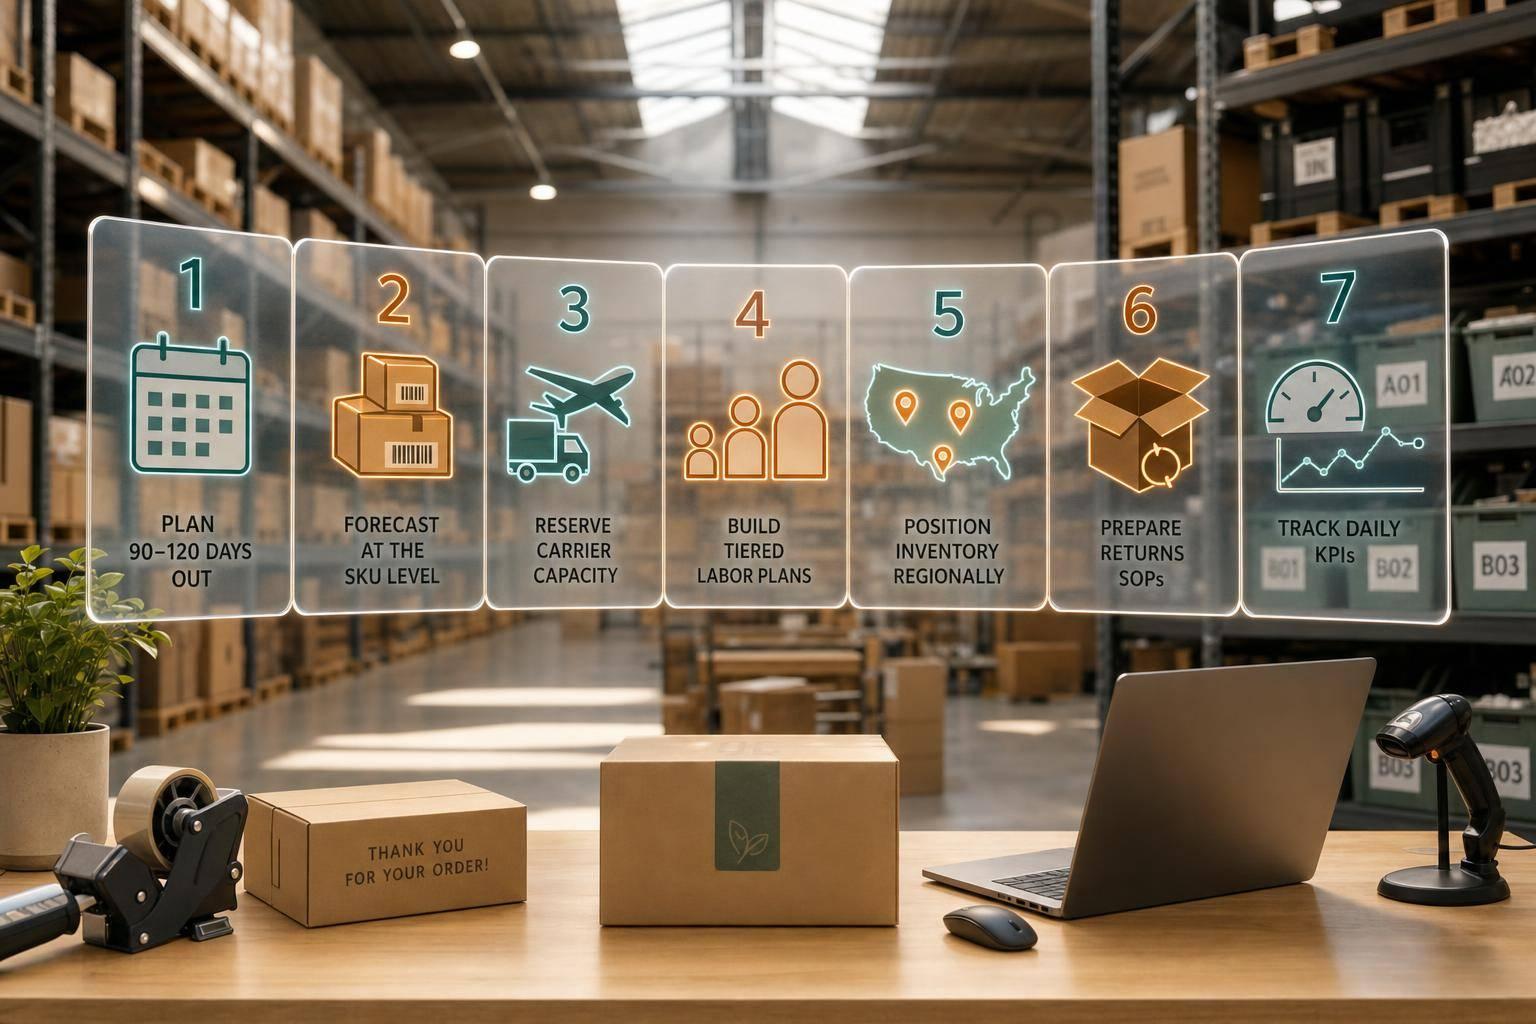
Peak season problems usually start before November. If I wait until Q4 to plan, I’m already late. For most DTC brands, the work starts in July through October: forecast demand by SKU, book carrier space, plan labor, trim SKU mess, place inventory near demand, set returns rules, and watch daily service levels.
Holiday volume can hit 3x to 5x normal order levels, and Cyber Week drives about 17% of U.S. holiday online spend. That means one weak spot - forecasting, staffing, shipping, or returns - can turn into late orders, higher parcel costs, and more support tickets. The fix is simple in theory: plan early, keep the SKU mix tight, and track performance every day.
Here’s the full article in one short list:
- Forecast at the SKU level with base, high, and stress cases
- Reserve carrier capacity early and set clear shipping cutoffs
- Build labor tiers for normal, high, and spike days
- Cut SKU and bundle complexity before volume hits
- Place inventory by region to lower zones and transit time
- Set returns workflows early so January doesn’t clog the floor
- Track daily KPIs like accuracy, same-day ship rate, and receiving time
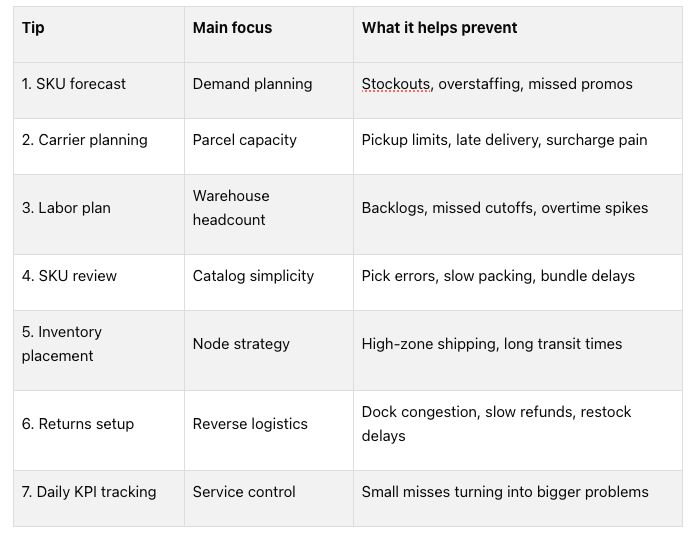 If I had to boil the article down to one line, it’s this: peak season goes better when I lock the plan 90–120 days early and give my 3PL clear numbers to work from.
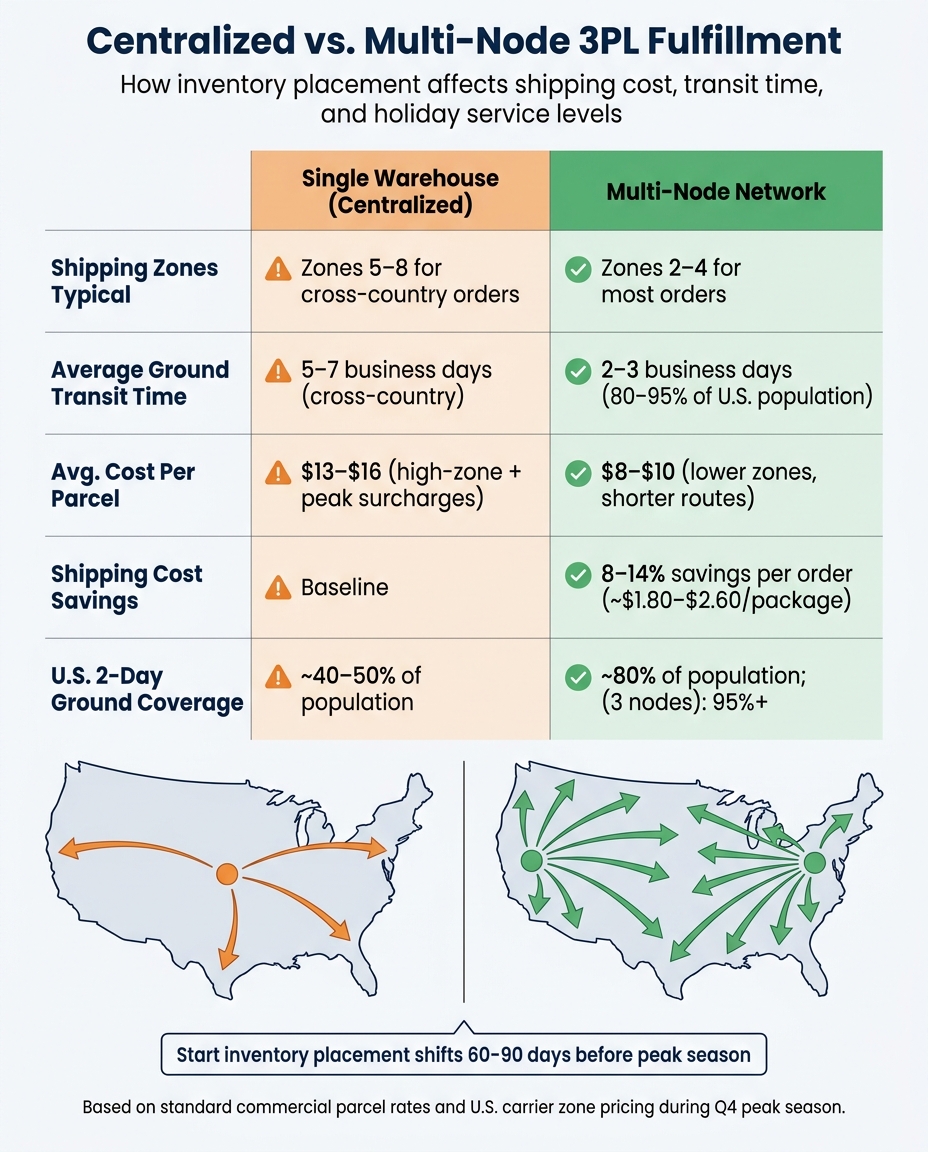
Centralized vs. Multi-Node 3PL Fulfillment: Cost & Speed Comparison
How to test 3PL cutoffs and contingency plans before peak
sbb-itb-eafa320
Why Peak Season Planning Falls Apart for Fast-Growing DTC Brands
Fast growth makes peak season harder in a very specific way: everything breaks at once. A holiday spike doesn’t just pressure forecasting. It also hits labor, carrier capacity, and cash flow at the same time. The brands that struggle most usually aren’t ignoring peak. They’re planning at a high level and missing the choke points that cause performance to slip. The seven planning steps below focus on those choke points head-on.
Promotion-Driven Demand Swings
One of the biggest forecasting mistakes is treating peak like one big seasonal wave.
That’s not how demand shows up in practice. It tends to land in sharp bursts tied to promotions. A Black Friday email, a paid social push, or a product drop can move daily orders from 2,000 to 8,000 or even 10,000 in just a few days. That kind of jump changes the whole operating picture.
When marketing and operations aren’t working from the same daily volume model, the result is predictable: operations staffs for an average day, while marketing triggers a worst-case day.
Carrier and Parcel Capacity Limits
Carrier capacity gets locked in earlier than many brands expect.
National carriers like UPS and FedEx assign peak capacity in early fall. If a brand doesn’t pre-commit volume, pickups can get throttled or even rejected during the busiest weeks. And once that starts, shipping gets slower and more expensive fast.
Orders may have to move through higher shipping zones - Zone 5–8 instead of Zone 2–3 - which can add 1–3 business days to U.S. ground transit. Cost per parcel climbs too. Peak surcharges make it worse: a residential ground shipment that might usually cost about $9 can end up between $13 and $16 once multiple surcharges stack.
Warehouse Labor Constraints
Labor is often where a volume spike turns into a backlog.
Seasonal labor shortages slow picking and increase error rates. Industry data shows that 76% of supply chain leaders have dealt with notable workforce shortages, and 58% say those shortages have directly hurt customer service levels. That’s not a small operational headache. It hits the customer experience almost right away.
The timing matters here. Seasonal hiring should start 4–6 weeks before peak begins.
SKU Growth and Fulfillment Complexity
More SKUs don’t just mean more sales options. They also mean more fulfillment complexity.
Each new SKU, bundle, or gift set adds work across slotting, picking, and packing. Gift sets and kits are especially hard on throughput because they add assembly steps and need specific packing materials. A catalog can look strong on the front end while becoming messy on the warehouse floor.
The warning signs usually show up in plain sight:
- Rising pick errors
- Longer pack times
- Growing inventory discrepancies
Those are signals that SKU sprawl is starting to drag down execution.
Inventory Placement Problems Across U.S. Regions
A single fulfillment node often creates a zone problem.
If top SKUs are sitting on the West Coast while demand jumps in the Northeast or Southeast, orders end up shipping across Zones 6–8 instead of Zones 2–4. That can add 2–3 business days to ground transit and push parcel cost per order from about $8–$10 up to $13–$16.
This is where delivery performance starts to split. Some customers get their orders in 2–3 days. Others wait 5–7. That gap tends to drive complaints, “Where is my order?” tickets, and extra pressure on support teams.
Returns Volume After the Holiday Peak
Returns after the holidays don’t ease in. They hit in a wave.
Roughly 30% of holiday orders may be returned in the two weeks after Christmas, and return requests can jump 40%–45% in the days right after December 25. For many brands, that creates a second peak right after the first one.
Returned items also take more room and more handling. They need an estimated 15%–20% more distribution center capacity than outbound goods because their dimensions are less consistent and staging is harder. Without a returns workflow ready before peak starts, inbound volume clogs docks, slows restocking, and delays refunds.
That starts with a SKU-level forecast.
1. Build a SKU-Level Peak Order Forecast
Once the problem is clear, the next move is a SKU-level forecast. For peak planning, a revenue estimate isn't enough. Your 3PL needs unit forecasts by SKU, by week or day, and by channel.
Start with 12–24 months of order history split by SKU, channel, and destination region. Use last year's weekly unit sales as the baseline, then adjust for year-over-year growth.
Next comes your promotion calendar. Turn each campaign into a SKU-level demand lift. Black Friday/Cyber Monday promos can push single-day demand up 3x to 10x, and featured SKUs often jump more than the rest of the catalog.
Build at least three scenarios: conservative, base, and aggressive. These scenarios shape how much inventory your 3PL should hold, how many pickers it should schedule per shift, and which carrier service levels it should reserve. When the forecast is solid, 3PLs can pre-slot fast movers, cut travel time, and help protect accuracy. When the forecast is off, teams end up scrambling, overtime climbs, and mistakes follow.
Timing matters here. Start 90–120 days before peak, lock core promo SKUs four weeks out, and review the forecast every week during peak. Then share the full file with your 3PL: SKU rows, weekly columns, channel splits, and the promo calendar. That gives them what they need to staff, slot, and reserve capacity before the rush hits. It also becomes the working input for carrier commitments and warehouse staffing.
2. Lock In Carrier Capacity and Shipping Cutoffs
Your SKU-level forecast only helps if carriers can move the volume you expect. During peak season, that window can shrink fast.
After the forecast is done, lock in the network that will carry those orders. Carrier capacity at UPS and FedEx starts tightening by November 10, so Q4 capacity agreements should be in place before August. A 3PL can reserve space across major carriers like FedEx, UPS, DHL, and regional networks. It can also line up pickups with your inventory flow.
Put holiday shipping cutoffs front and center on your storefront. Shoppers should see those dates clearly, so they know when on-time delivery is no longer guaranteed.
Also, make sure one operations manager owns carrier exceptions and cutoff updates - not a shared inbox. Shared ownership sounds fine until something slips through the cracks. Once carrier capacity is set, labor is usually the next bottleneck.
3. Build a Tiered Labor and Warehouse Staffing Plan
Once carrier capacity is set, the next issue is simple: can the warehouse keep up? If your team can’t pack and stage orders on time, that reserved carrier space won’t help much.
Start with weekly order forecasts and turn them into three labor tiers: baseline, elevated, and surge. Then translate forecasted order volume into labor hours for each function:
- receiving
- picking
- packing
- shipping
From there, set clear tier triggers and preapproved staffing moves. That way, you’re not making last-minute calls when volume spikes.
Labor pressure tends to show up fastest in two areas: pick-and-pack throughput and same-day ship commitments. If picking or packing falls behind, orders pile up and miss carrier cutoffs. That’s why staffing tiers should line up with the carrier pickup window, not just standard shift times. If you want same-day ship rates to hold during the busiest weeks, labor has to be in place when those cutoff times hit.
A practical staffing mix looks like this:
- 60–70% core full-time staff
- 20–30% temporary workers
- 10–20% seasonal hires
Core staff are usually best for kitting and custom work. Temporary staff can take on standard pick-and-pack volume. On top of that, add a 15–20% labor buffer to your headcount plan to cover no-shows, attrition, and the slower ramp-up that comes with new seasonal workers.
Timing matters here. Start recruiting 8–12 weeks before peak and have seasonal workers trained 30 days before the highest-volume weeks. Cross-train associates across receiving, picking, packing, and returns so you can move people as constraints shift. And during peak, they do shift fast. One day the issue is picking. The next day it’s packing. Then returns starts clogging the floor.
Once staffing is mapped, the next bottleneck is SKU complexity.
4. Review Your SKU List and Cut Fulfillment Complexity
Even if your staffing plan is solid, an oversized SKU catalog can still drag down output. SKU complexity is one of the biggest reasons warehouses slow down during peak. When a team is juggling hundreds of variants, lookalike products, and custom bundles at the same time, mistakes pile up fast. Every extra pick decision adds friction.
Start your SKU review 4–8 weeks before peak. Pull data from your 3PL on pick time per line item, error rates by SKU, and packaging exceptions. Then look for the problem items: SKUs that take longer to pick, lead to mis-ships, or need special handling. Those are the ones most likely to cause trouble when order volume spikes. Match that warehouse data with sales velocity and margin, then sort your assortment into three buckets: active, limited, or paused until January.
Bundles are often where you can cut the most time. The big win comes from turning multi-item picks into pre-kitted SKUs. Instead of asking pickers to grab three or four separate items for one order, assemble those sets ahead of time and store them as one SKU. That cuts pick time and helps reduce mis-picks. As peak gets closer, trim bundle choices too. Sticking to two or three configurations - and using the same box size and insert layout across them - makes packing far more repeatable.
Once your peak assortment is locked in, send it to your 3PL early so they can reset slotting before volume starts climbing. Put fast movers at waist-to-shoulder height near pack stations, and keep lookalike variants apart. A simpler assortment also makes regional inventory placement easier.
5. Place Inventory Across the Right U.S. Fulfillment Nodes
Inventory placement has a direct effect on both shipping cost and delivery speed during peak. In plain terms: where you stock products can shape margins just as much as your carrier mix.
U.S. carriers price ground shipping by zone, which is the distance tier between your ship-from location and the customer’s ZIP code. Zones range from 1 to 8. The higher the zone, the farther the package travels, and the more you pay. So if you ship from a single East Coast warehouse, a big share of West Coast orders will land in Zones 6–8. Add a West Coast node, and much of that same volume can fall into Zones 2–4 instead. That kind of move can cut average outbound shipping cost by 8–14% per order, or about $1.80–$2.60 per package at standard commercial parcel rates.
Speed matters too. A two-node East/West setup can put about 80% of the U.S. population within 2-day ground coverage. Add a third central node, and coverage can climb to 95%+. During holiday peak, that’s a big deal. Shoppers buying gifts often expect delivery in 2–3 days, and a nearby ground node can often hit that window without the extra cost of air service.
Don’t spread inventory evenly just because it feels tidy. Put stock where demand is. Look at the last 12–24 months of orders by ZIP code or region and find out where customers are actually buying. Then:
- Place fast-moving SKUs in each node that serves a high-demand region
- Keep slower-moving SKUs in one main node to avoid split replenishment
Timing matters here. Start the shift 60–90 days before peak. That gives you enough room for demand analysis, node selection, inventory transfers, receiving, and routing setup. Then use your OMS to route orders based on zone, cost, stock, and capacity, so the multi-node setup saves money on paper and in practice.
Once inventory is in place, the next pressure point is what happens when holiday orders start coming back.
6. Set Up Returns and Reverse Logistics Before Holiday Volume Hits
Outbound planning is only half the job. Returns surge after the holiday rush, so the reverse-logistics plan needs to be ready in August through October, before January volume lands.
Work with your 3PL to create a written Returns SOP that covers the full path from initiation to refund and restocking. Spell out how customers start returns, what gets approved, how RMAs are matched, what inspectors check, and where each item goes next: restock, refurbish, recycle, or write off. Without a clear SOP, teams end up making judgment calls on the fly. That’s when small mistakes pile up fast once inbound volume jumps.
Space planning matters just as much. Returned items take more room and more handling than outbound goods - about 20% more warehouse capacity - because each unit has to be inspected, sorted, and staged one by one. Set aside dock lanes, inspection stations, and separate areas for sellable inventory, needs-refurbishment units, and disposal stock before peak starts. A dedicated returns area helps keep reverse flow from slowing down core picking and packing.
Set SLAs that are simple and strict:
- Scan within 24 hours
- Inspect and disposition within 24 hours
- Refund eligible items within 1–2 business days
That puts the full cycle at about 3–5 days from arrival to refund for most standard cases. When that window slips, negative reviews tend to go up and repeat purchase rates tend to drop. On the flip side, when returns are restocked within 24–48 hours, those units get back into available inventory fast and can help cover stockouts on popular SKUs in January.
Reverse logistics protects CX, margin, and January inventory accuracy. Once the returns flow is live, track daily service levels so you can spot delays early, before they spread.
7. Track 3PL Service Levels Daily During Peak
Once returns are live, daily monitoring becomes your last checkpoint before customer issues start piling up. This is where you see whether your peak plan is working in the real world. Small misses can snowball fast. A delay on Monday can easily show up as a support headache by Thursday if no one spots it early.
The KPIs to watch every day are order accuracy rate, same-day ship rate, receiving turnaround time, and backorder or unfulfilled order rate. Order accuracy should stay at 99.5% or higher. Same-day ship rate should stay above 95% for orders placed before cutoff. Standard inbound shipments should be received within 24–48 hours. Once that stretches past 48 hours, hot SKUs can start falling behind.
Each KPI should lead to a clear action. Order accuracy points to pick-and-pack errors that need to be isolated. Same-day ship rate tells you when it's time to adjust labor or change cutoffs. Receiving turnaround helps protect replenishment. Backorders signal that you may need a SKU-level or inventory fix. A 3–5 point drop in same-day ship rate from one day to the next, or a growing receiving backlog while labor stays flat, usually points to an operations issue, not a random blip.
Use a shared dashboard for your team and your 3PL account manager. Refresh it each morning and again before carrier cutoffs. Then run a daily 15-minute standup focused on SLAs, today’s volume, carrier risk, and escalation calls. If one node’s same-day ship rate slips, move volume, add a shift, or tighten shipping promises on your storefront before customers place orders you can’t ship on time.
Set a clear escalation path too. If KPIs miss targets for two to three days in a row, the right owners should hear about it that same day.
Those daily signals show where a multi-node 3PL should shift labor, inventory, or carrier volume next.
How a Multi-Node 3PL Partner Can Help During Peak
Once daily KPIs are in place, the next step is simple: who can move on them fast? These seven steps only work when one 3PL can carry them out across fulfillment, transportation, and returns without delay.
JIT Transportation supports peak execution with distribution, fulfillment, pick and pack, kitting, testing, white-glove handling, and returns management.
How One Provider Reduces Coordination Risk
When transportation, warehousing, and fulfillment are split across different vendors, every handoff becomes a place where things can go wrong. A missed dock appointment, a carrier cutoff issue, or inventory data that doesn’t match can snowball fast. And the fix gets messy because no one team owns the whole picture.
A single integrated 3PL changes that setup. The warehouse and transportation teams work inside the same WMS and TMS, so order status, node-level inventory, and shipment data live in one place. That means one team can shift labor, routing, and inventory without waiting on back-and-forth between vendors.
If a promotion performs better than expected and inbound volume jumps, the provider can reassign labor, re-slot inventory, and move transportation allocations internally. That ties straight back to the forecasting, staffing, and carrier capacity work handled in the earlier planning steps.
If a winter storm slows outbound movement in the Midwest, the same provider can reroute orders to Southeast or West Coast nodes and update delivery estimates through one interface. No cross-vendor approvals. No extra lag.
How Multi-Node Fulfillment Supports Faster Ground Delivery
Multi-node routing helps keep more orders in lower-cost zones and shortens transit times. Instead of shipping everything from one warehouse, inventory sits closer to where customers are. That cuts zone costs and speeds up delivery, which links directly to the inventory placement choices made in step five.
When a multi-node 3PL uses advanced analytics, it can model node placement against order history and SKU velocity before peak. That helps teams pre-position inventory in the right locations, so orders route from the closest node automatically.
Value-Added Services That Help During Peak
Peak season usually brings more than just volume. It also adds bundle complexity and extra handling needs. A 3PL that can assemble bundles at scale keeps kitting from slowing down standard single-SKU orders running on the same floor. That builds on the SKU simplification and pre-kitting work from step four.
Kitting, testing, white-glove handling, and returns can all plug into the fulfillment workflow, so complex orders route on their own without manual intervention during the busiest weeks of the year.
This works best when the brand shares its promotion calendar and bundle structures with the 3PL 60–90 days before peak. That gives the operation enough time to standardize SOPs, train warehouse staff, and tag orders in the OMS so kitting, personalization, and white-glove workflows route automatically.
Use the same inputs to build the visuals below: forecast checklist, carrier cutoffs, inventory placement, and KPI snapshot.
Visuals to Add to This Article
Use these visuals to turn the seven planning steps into tools the whole team can work from. Start with the forecast sheet, then let it guide carrier choices, labor planning, inventory moves, and returns handling. Each one lines up with a peak-season decision point, so people aren’t guessing when volume starts to spike.
Forecast Input Checklist
Build this as a shared intake sheet. It should include promotion details such as the promo name, dates in MM/DD/YYYY format, expected uplift percentage vs. baseline, and promo type.
It should also track channel mix by order volume across:
- Direct site
- Email campaigns
- Paid social
- Marketplaces
Add SKU-level velocity data too. Include historical daily averages and a 30/60/90-day trend flag for each SKU: rising, flat, or falling.
You’ll also want fields for inbound replenishment dates, supplier lead times in days, safety stock assumptions by SKU, and peak windows. That way, the sheet does more than estimate demand - it helps the team spot where stock pressure is likely to show up first.
Carrier Service-Level Reference
Build this as a quick-reference sheet for operations and CX. Keep it simple enough that someone can scan it fast during a busy shift.
For each carrier option, show:
- Carrier type
- Service level
- Typical transit time in business days
- Holiday cutoff date
- Local warehouse cutoff time
- Expected delivery performance
- Preapproved backup option if the primary carrier hits capacity
- Peak surcharge estimates in USD
This visual should help teams answer the same few questions over and over, without digging through old emails or rate sheets.
Centralized vs. Multi-Node Inventory Placement
Use this side-by-side graphic to compare the two models across shipping cost, average transit time, inventory complexity, and service-level risk. Use concrete numbers, not broad labels.
That matters because the trade-off is pretty straightforward on paper, but messier in practice. Splitting inventory across nodes can cut shipping cost and reduce delivery time. At the same time, inventory gets harder to manage. Stock has to be divided, replenishment logic gets more involved, and SKU placement decisions depend on regional demand weighting.
The visual should make that trade-off easy to see so leadership can judge when the cost and speed gains are worth the added operating overhead.
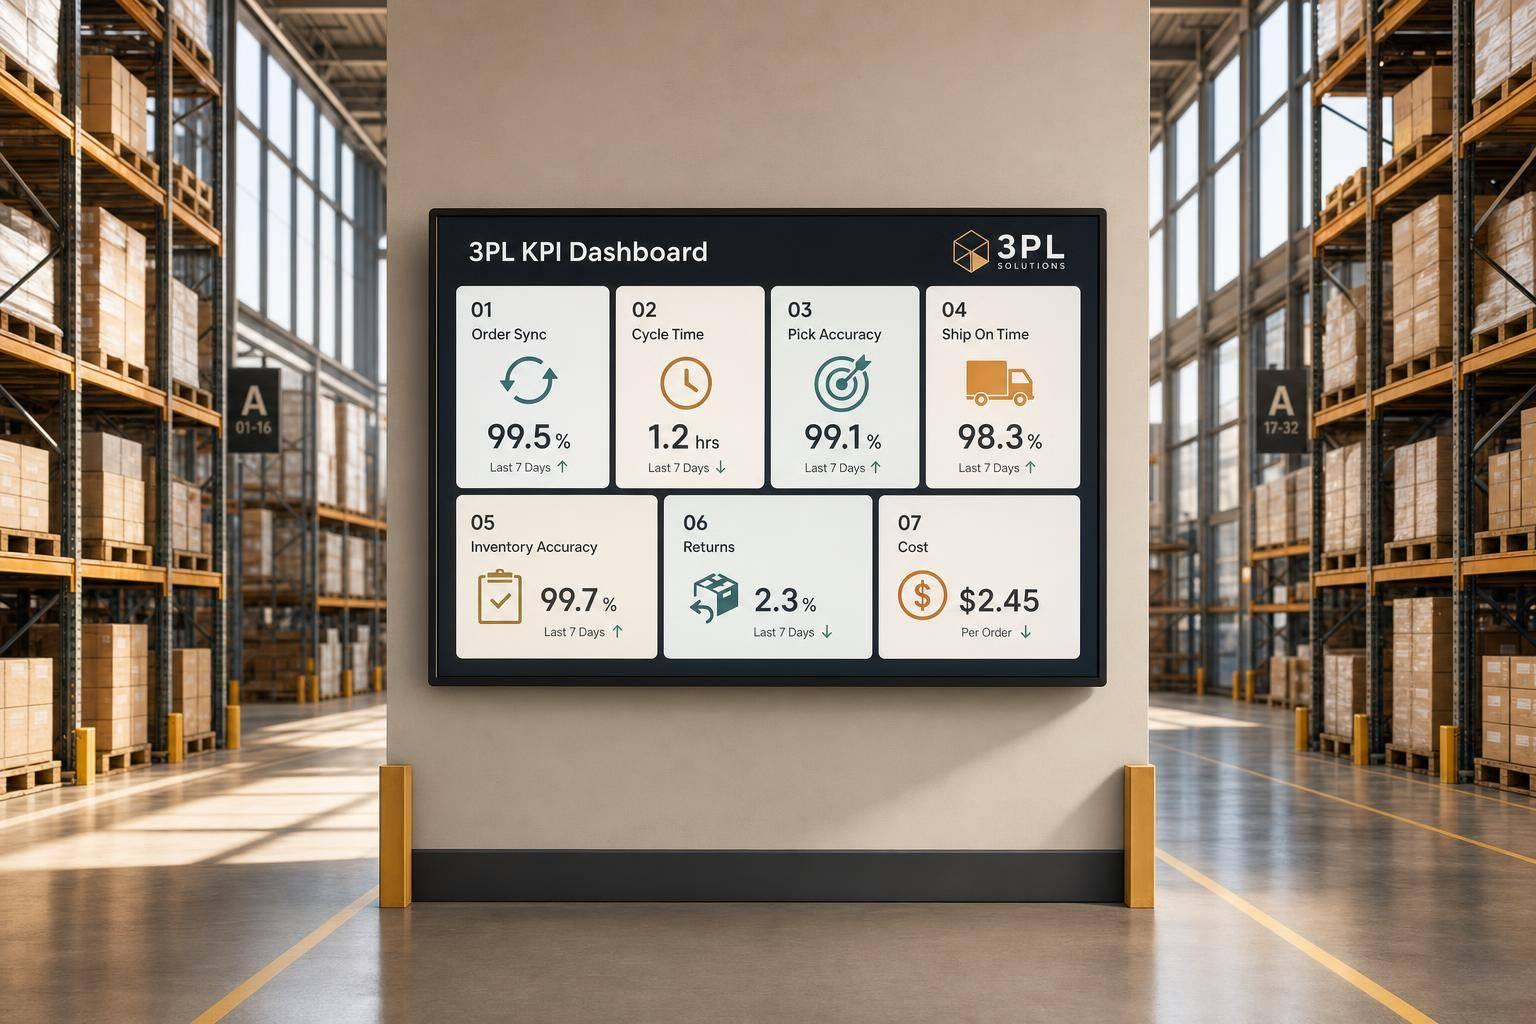
Peak KPI Snapshot
This dashboard-style visual should track five daily metrics with clear targets and green / yellow / red status indicators. Add a 7-day rolling trend line next to each one so teams can spot slippage early instead of reacting after service levels drop.
Track these five metrics:
- Order accuracy
- Same-day ship rate
- Inventory accuracy
- Receiving turnaround
- Return disposition time
Targets can be set at ≥99.5% order accuracy with an alert below 99%, ≥95% same-day ship rate, ≥98–99% inventory accuracy for A and B SKUs, receiving turnaround in under 24 hours for peak-critical SKUs, and return disposition time of 2–3 business days from receipt to disposition.
Conclusion
After service-level tracking comes discipline. Peak performance is set before the first holiday shipment leaves the dock. That means locking forecasts, carrier capacity, staffing, and assortment decisions 90–120 days before peak.
These seven steps work as one system: forecast demand, lock capacity, staff to volume, simplify the SKU mix, place inventory closer to demand, prepare returns, and monitor service levels every day.
Put service-level expectations in writing with your 3PL before Q4. Then review the plan against base, high, and stress cases. Brands that do this on a steady basis are in a much better spot to avoid stockouts, missed delivery promises, and emergency shipping costs when volume jumps.
If anything is still uncertain by October, act now. Every week you wait shrinks your room to adjust before peak. Peak season tends to reward brands that lock the plan early.
FAQs
When should I start peak season planning with my 3PL?
Start several months ahead. A solid timeline looks like this:
- Demand forecasting: 3 to 6 months before peak
- Carrier coordination and capacity planning: 60 to 90 days out
- Labor recruiting: 8 to 12 weeks ahead, or 12 to 14 weeks in competitive markets
- Systems testing: 2 to 3 weeks before peak
How do I know if I need multi-node inventory placement?
You may need multi-node inventory placement when demand clusters in regions far from your current fulfillment center. Spreading inventory across more than one location can cut shipping zones and distance, which helps lower delivery costs and get orders to customers faster.
It can also help when seasonal demand shifts or when you need more safety stock in certain areas. A 3PL like JIT Transportation can use velocity-based allocation to position fast-moving SKUs closer to key U.S. customer hubs.
Which daily KPIs matter most during peak season?
The daily KPIs that matter most are the ones that protect service levels and keep work moving when volume spikes.
That usually comes down to a short set of numbers:
- Order fulfillment and on-time shipping rates
- Pick rates per labor hour
- Dock-to-stock cycle times and inventory accuracy
- Schedule agility and work queues by area
Real-time dashboards make this much easier. They help you spot bottlenecks fast and shift labor where demand is building, before a small slowdown turns into a bigger problem.
Related Blog Posts
Related Articles
7 WooCommerce 3PL KPIs Teams Track

Centralized vs Decentralized Replenishment
