
Deep Learning for Multi-Product Demand Forecasting

If your forecast mixes channels, ignores stockouts, or treats each SKU on its own, you will miss demand and misplace inventory.
I’d sum it up like this: deep learning works best for multi-product forecasting when I train one shared model across the catalog, keep data split by SKU, channel, and location, and feed it clean inputs like sales, inventory, promotions, returns, and stockout flags. When that setup is done well, teams can cut forecast error by up to 50% and lower holding costs by 15% to 20%.
Here’s the short version:
- Don’t forecast each SKU in isolation. Low-volume items and new launches often lack enough history.
- Keep channel demand separate. A blended view can hide local shifts and lead to stockouts in one place and excess in another.
- Map bundle sales to component SKUs. If I skip that, component demand gets distorted.
- Flag stockouts. A zero sale during an out-of-stock period is not zero demand.
- Use features that explain demand moves. Calendar, promo, price, product attributes, and channel data all matter.
- Match the model to the job. Stable items may fit simple models; volatile lines may need LSTM, TCN, or transformer-based models.
- Judge forecasts by planning results. I’d track MAPE, forecast bias, and prediction ranges by SKU, region, and channel.
- Push forecasts into execution systems. Forecasts matter when they guide reorder points, safety stock, purchase orders, and warehouse planning.
At a basic level, this is not just a modeling task. It’s a data, forecasting, and inventory planning system that has to stay aligned from training through replenishment.
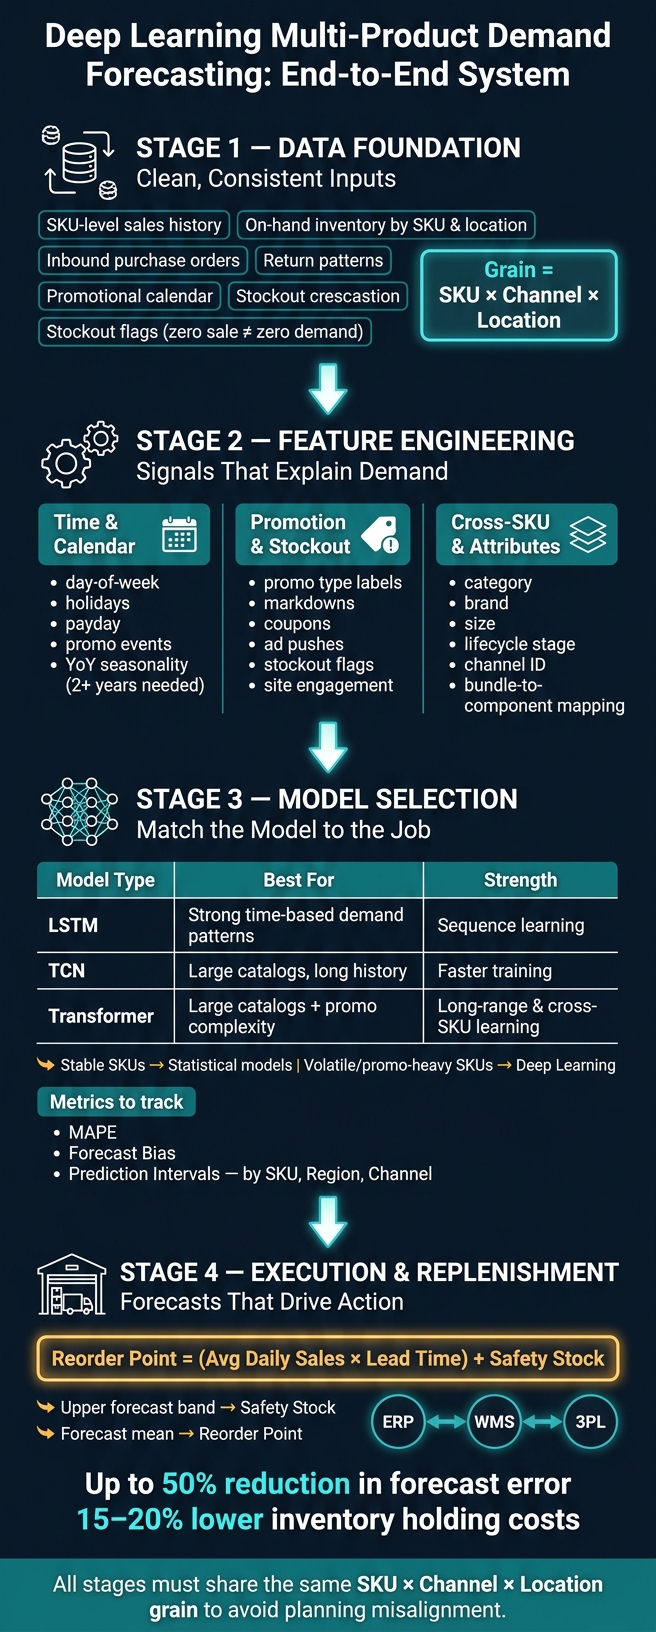
Deep Learning Demand Forecasting: End-to-End System Overview
Deep Learning for Demand Forecasting and Reinforcement Learning for Inventory Planning
sbb-itb-eafa320
Data Foundation: Scope, Inputs, and Cleaning Rules
A global model only works if every SKU, bundle, channel, and location shares the same clean history. That work starts with one basic choice: the forecasting grain.
Set the Forecasting Grain Across SKUs, Bundles, Locations, and Channels
Define the forecast grain first. Decide whether forecasts should be produced at the SKU, channel, and location level so the model lines up with how demand moves through the network. Keep channel demand separate. If you blend those signals too early, planning mistakes show up later.
Bundle and multi-pack demand needs extra care. When a customer buys a bundle, that sale should be mapped back to each component SKU. If you skip that step, you'll double-count inventory and miss what component demand actually looks like.
Core Inputs: Sales, Inventory, Promotions, Stockouts, and External Signals
The minimum input set includes:
- Historical SKU-level sales
- On-hand inventory by SKU and location
- Inbound purchase orders with arrival timing
- Return patterns
- A detailed promotional calendar
External signals like holiday calendars and weather data can add more context.
The input teams most often get wrong is the stockout flag. When a SKU goes out of stock, sales fall to zero. But that zero does not mean demand was zero. It's censored demand, not true demand. Without a flag for those periods, the model learns the wrong baseline.
Cleaning and Harmonizing Data Before Training
Data comes in from multiple systems - ERP, OMS, WMS, and your commerce platform - and they almost never match cleanly. Names differ. Units differ. Date formats differ. Before training, make sure each SKU uses one consistent name across systems. Normalize individual units and cases so they don't end up mixed inside the same time series. Align dates in en-US format and sort the series in chronological order.
Missing values and returns need one clear handling rule too. Unmatched returns can inflate sell-through and push forecasts too high. For new product launches with no sales history, use substitute signals such as pre-orders, waitlist sign-ups, and comparisons to similar SKUs.
Once the series is cleaned and lined up, the next step is turning that data into forecast features.
Feature Design: Turning Raw Operations Data Into Forecast Signals
Once your data is clean, the next job is to turn raw operations data into signals a shared model can use across SKUs, bundles, and channels. Put simply: transactions on their own don't explain much. You need features that show why demand moves up, down, or sideways.
Seasonality, Trend, and Calendar Features
Start with time-based features the model can learn from again and again. That includes day-of-week, monthly, holiday, payday, and promo calendars. Promo calendars matter here as model inputs, not just records sitting in a source system. If an event caused a spike, spell that out in the data. Otherwise, the model may treat it like random noise.
For year-over-year seasonality, you need at least two years of history to give the model enough cycles to learn from. Without that history, holiday effects and seasonal indices will be shaky.
It also helps to add channel ID or channel-level seasonality features. One channel may peak on weekends while another leans harder into month-end demand. Mix those together, and the signal gets muddy fast. These time features give the model a starting point before you layer in promotions and stockouts.
Promotion, Price, and Stockout-Aware Features
Promotions shouldn't be lumped together as one big demand bump. Label promotions, markdowns, coupons, ad pushes, and price changes separately so the model doesn't confuse them with organic demand. That distinction matters a lot. A discount-driven surge is not the same as steady customer pull.
Stockout flags matter too. If sales drop to zero because inventory ran out, the model needs to learn that zero does not mean demand disappeared. It means demand was missed.
Site engagement can also act as a leading indicator. If traffic, product views, or other engagement signals start climbing before orders do, the model gets an earlier read on demand building before it turns into a sale. Once these demand drivers are encoded, the model can start learning which patterns matter most across SKUs.
Cross-SKU, Attribute, and Bundle Features
When one global model covers hundreds or thousands of SKUs, shared product attributes help it learn across the whole catalog. This is where category, brand, size, color, pack count, and lifecycle stage come in. A new launch and a mature SKU behave differently, and the model should see that. If a product has little or no history, these attributes let the model borrow signal from similar SKUs instead of flying blind.
Channel and region should stay segmented as well. Blended averages may look neat on a dashboard, but they can hide local stockout risk or channel-level demand shifts. That's a classic case of smoothing away the very thing you need to see.
Bundle sales need extra care. Split bundle sales to component SKUs before feature generation. If you don't, replenishment signals for the components get warped, and individual parts can run out even when the bundle still looks fine on paper.
Those are the inputs the model uses to learn patterns across products, markets, and sales paths. The next piece is how those features plug into model architecture and backtesting.
Model Design and Evaluation: Choosing the Right Forecasting Setup
Those cleaned features need a model that can learn demand patterns across the entire catalog, not just one item at a time.
Global vs. Local Models for Many SKUs
For steady evergreen SKUs with easy-to-predict demand, simple statistical models often do the job well. But for volatile catalogs where promotions can swing demand hard, global deep learning models tend to perform better. Why? Because they can use signals like promotions, price, channel, and product attributes more effectively across many SKUs.
In practice, a hybrid setup is often the smartest move. Use simpler statistical rules for stable items, then apply adaptive machine learning to high-volatility product lines. That way, you don't overbuild where demand is calm, and you don't under-model where things change fast.
Once you choose that model strategy, the next step is architecture. And that choice shapes how well the system learns long-range behavior and cross-SKU relationships.
Common Architectures: LSTM, TCN, and Transformer-Based Models
LSTM models are good at learning sequence patterns over time, so they work well for SKUs with strong time-based demand behavior.
TCNs can handle long history windows more efficiently, and they usually train faster than recurrent models when you're dealing with a big catalog.
Transformer-based models go a step further. They can learn long-range effects and cross-SKU relationships at the same time, which makes them a strong fit for large catalogs with messy promotion patterns and attribute interactions.
Backtesting, Forecast Metrics, and Uncertainty Bands
After you pick a model, backtesting tells you whether the forecast helps with planning, not just whether it looks good on a chart. The real test is its effect on purchase orders, inventory transfers, and campaign decisions - not dashboard fit.
Regular reviews should compare forecasted demand against actual demand to spot persistent bias and adjust lead times or promotion assumptions when needed.
It's also important to track error at the right level. Watch MAPE and Forecast Bias by SKU, region, and channel, because blended averages can hide problems.
And don't stop at a single-number forecast. Prediction intervals give planners a range of likely demand, which helps teams set safety stock, protect service levels, and move sooner when demand starts to shift.
Using Forecast Output in Replenishment and Logistics Planning
A dashboard-only forecast doesn't change operations. The payoff shows up when forecasts shape purchasing, stocking, and fulfillment.
From Forecasts to Reorder Points, Safety Stock, and Purchase Orders
Once backtesting shows the model is reliable, turn forecast ranges into replenishment rules. The simplest way to move from prediction to action is the reorder point formula: Reorder Point = (Average Daily Sales × Lead Time) + Safety Stock. Use the forecast mean to set reorder points, and use the upper band to set safety stock.
Forecast uncertainty helps you decide when to order and how much buffer to carry. And for lead times, use past supplier performance, not the number quoted on paper.
Break forecasts down by SKU, channel, region, and bundle component before you allocate inventory. For bundle components, push replenishment signals to each part on its own. Otherwise, one item can run out while the bundle still looks fine on the surface. A blended sitewide average sends stock to the wrong places across your fulfillment network.
Accurate demand forecasting can cut stock holding costs by 15% to 20%. But that only happens when the forecast is tied to the execution layer where purchasing and inventory decisions get made.
Connecting Forecasts to ERP, Warehouse, and 3PL Workflows
Those rules matter only when they reach the systems that place orders and move inventory.
Send forecast output into ERP, WMS, and 3PL workflows so teams can trigger purchase orders, plan inbound receiving and put-away, and line up labor and dock capacity with expected volume. If those systems aren't connected, each team works from a different set of numbers. That's when demand from marketing gets missed, even though it was visible in the forecast.
ERP, WMS, and 3PL execution should use the same SKU, channel, and location splits as the forecast model. If the forecast is detailed but the warehouse plan is broad, things fall apart fast.
JIT Transportation supports ERP-connected distribution and fulfillment, pick & pack, kitting & assembly, testing, white glove handling, and returns management.
Conclusion: What Strong Multi-Product Forecasting Requires
Strong multi-product forecasting is a connected system, not just a single model. Data, features, model choice, and execution all have to work together.
That falls apart fast if the data, features, and model don’t use the same forecasting grain. The starting point is clean, consistent history at the SKU, channel, and location level. Without that baseline, even a good model can pick up the wrong demand pattern and send planning in the wrong direction.
Features are what turn day-to-day operations data into forecast signals. That means encoding seasonality, promotions, stockouts, and cross-SKU relationships. In practice, it helps to match the model to the job: use simpler models for stable SKUs, and deep learning for volatile, promotion-heavy lines.
The last test is operational alignment. A forecast matters only if planning teams can use it directly. It creates value when it flows into replenishment, purchase orders, safety stock, and warehouse planning using the same SKU, channel, and location splits the model learned from during training.
FAQs
When should we use a global model instead of forecasting each SKU separately?
Use a global model when individual SKUs don't have enough history for separate forecasts you can trust, or when demand is messy and non-linear.
Instead of treating each item on its own, a single model trained across many SKUs can learn shared trends, seasonality, and promo effects. That often leads to better accuracy and fewer errors than forecasting each item in isolation.
How do we forecast demand for new products with little or no sales history?
Forecasting demand for new products is tough when there’s little or no sales history to work with. In those cases, teams lean on data-based proxies and shared planning across the business.
AI models can connect a new item to similar products that already exist by looking at shared attributes. They may also factor in pre-launch signals, such as social media sentiment, market buzz, and planned promotions.
That only works if the basics are in place. Teams need clean master data, early agreement on launch calendars and seasonality, and frequent reviews once sales data starts to come in.
How often should we retrain a deep learning demand forecast model?
Retrain on a regular schedule and keep a close eye on performance so the model can keep up with shifting market conditions and live inputs. There’s no one-size-fits-all rhythm here. The right timing depends on how complex your operation is.
A simple way to stay on track: compare forecasts with actual results and look for bias that keeps showing up over time. If the model keeps leaning too high or too low, that’s a sign it needs attention.
For seasonal events, a common best practice is to train models 60 to 90 days in advance. After that, keep updating them with both historical data and real-time signals.
Related Blog Posts
Related Articles
7 WooCommerce 3PL KPIs Teams Track

Centralized vs Decentralized Replenishment
