Demand-Driven Replenishment for Multi-Node 3PL

I start with where customers need stock - not which warehouse shipped their last order. Using 90–180 days of demand by destination, I set SKU-level targets for each node based on lead times, delivery promises, and capacity.
Then I connect those targets to the decisions that keep your network supplied:
- Verify stock: Separate usable units, commitments, confirmed inbound shipments, and holds.
- Set replenishment rules: Account for demand swings and lead-time delays.
- Balance locations: Transfer surplus only when timing and total cost justify the move.
- Place incoming stock: Choose central, regional, or mixed storage based on projected demand at arrival.
- Control execution: Assign owners, coordinate receiving, and track service, inventory, and freight costs.
The goal isn’t to stock every item everywhere. It’s to keep <u>the right stock in the right location</u> - and use each cycle’s results to guide the next decision.

Multi-Node 3PL Replenishment Cycle
Inventory Rebalancing in Excel | Optimize Multi-Warehouse Stock & Reduce Inventory Costs
sbb-itb-eafa320
Set Inventory Targets for Each Node
Set targets for each SKU-location pair, rather than using one national safety-stock percentage. Node targets turn regional demand signals into replenishment rules. Start by grouping SKUs by role, then use the inputs below to set each location’s target.
Group SKUs by Value, Demand, and Service Needs
Use annual dollar usage to assign ABC classes, then add XYZ demand stability and a simple service tier. Calculate annual dollar usage as annual demand × unit cost.
Assign service tiers - stock-critical, standard, seasonal, or long-tail - and document which nodes stock each class. Stock-critical items may need local coverage even when sales are low. Pool long-tail items unless delivery commitments justify stocking them at multiple nodes.
Calculate Reorder Points and Safety Stock
Reorder point = average demand during replenishment lead time + safety stock. Base safety stock on demand and lead-time uncertainty, forecast error, and the service target - not a flat percentage.
Inventory position = usable on-hand + confirmed inbound − open commitments. Subtract each commitment only once, even if it appears as both an allocation and a backorder.
For continuous-review min–max planning, replenish when the inventory position reaches the minimum, ordering up to the maximum within case-pack and capacity limits. For periodic review, cover the review cycle plus lead time using the same safety-stock logic. Keep pooled buffers only at central or regional nodes that can still meet downstream delivery promises.
The example below applies to one node. Assess each node’s inventory position separately.
Hypothetical calculation: At 240 units per week, a two-week replenishment lead time and 180 units of safety stock produce a reorder point of 660 units: (240 × 2) + 180. With 500 usable units, 300 confirmed inbound units, and 220 outstanding commitments, inventory position is 580 units, triggering replenishment. With a one-week review interval and an assumed 180-unit buffer, the order-up-to target becomes 900 units: 240 × (2 + 1) + 180.
Test Replenishment Policies Before Rollout
Pilot one representative product family across at least two regions. Include fast movers, slow movers, and different lead-time patterns. Document the current policy, then compare results using the same product scope and time horizon.
Track fill rate, stockouts, inventory investment, emergency freight, and transfer frequency. Adjust buffers, review intervals, and assortment rules before expanding.
Review high-volume or service-critical SKUs monthly and stable, low-volume items at least quarterly. Review sooner after material changes in demand or lead time. Record each change, its approver, effective date, and expected result. These targets become the floors and ceilings for transfer triggers in the next step.
Balance Stock and Set Transfer Triggers
Use the node-level targets from the prior section to trigger transfers across the network.
Set Stock Coverage Floors and Ceilings
Calculate weeks of supply using this formula:
(Usable inventory + confirmed inbound arriving before shortage − allocated orders) ÷ expected weekly demand
Base the calculation on node-level forecasts, promotions, seasonality, and open orders. For intermittent-demand SKUs, use order frequency, demand intervals, and service commitments. A zero-sales week doesn’t mean zero demand. Set the floor to cover lead time demand plus safety stock. Flag nodes expected to fall below that floor or miss a service commitment before replenishment arrives.
Stock above the ceiling points to possible donor surplus; stock below the floor signals shortage risk. Before choosing a donor, protect its forecast demand, safety stock, allocations, and commitments. Check its projected balance through the next replenishment window, not just today’s stock. Block transfers of reserved, quarantined, shelf-life-limited, lot-locked, serial-locked, or capacity-exceeding stock.
Compare Transfer Costs and Service Risks
Choose the lowest fully loaded cost option that still protects the delivery promise. Transfer stock when it can restore coverage before a shortage. Fulfill directly when an order can’t wait for put-away. Expedite supplier replenishment when the network has no surplus.
Compare freight, accessorials, handling, receiving, damage risk, and time until stock is pickable against expected lost margin and service penalties. Don’t move stock when the expected benefit is less than the cost. Consolidate transfers only when deadlines allow.
Track and Reconcile Every Transfer
Reserve units before picking. Scan SKU, quantity, and lot or serial data at departure, receipt, inspection, and put-away. Update the shared system of record used for replenishment decisions at each stage. Keep shipped units in transit and unavailable until receipt posts. Reconcile shipped, received, damaged, and put-away quantities, and investigate discrepancies before approving adjustments.
Track cost per recovered order, transit time, and service recovery. Use a 48-hour hold, or delay return transfers until receipt, unless an urgent exception is approved. Repeated reversals should prompt a review of forecasts, allocation rules, and transaction delays.
When transfers recur often, route the next replenishment upstream rather than moving stock repeatedly.
Pool SKUs and Route Inbound Supply
Choose Pooled, Regional, or Hybrid Stock
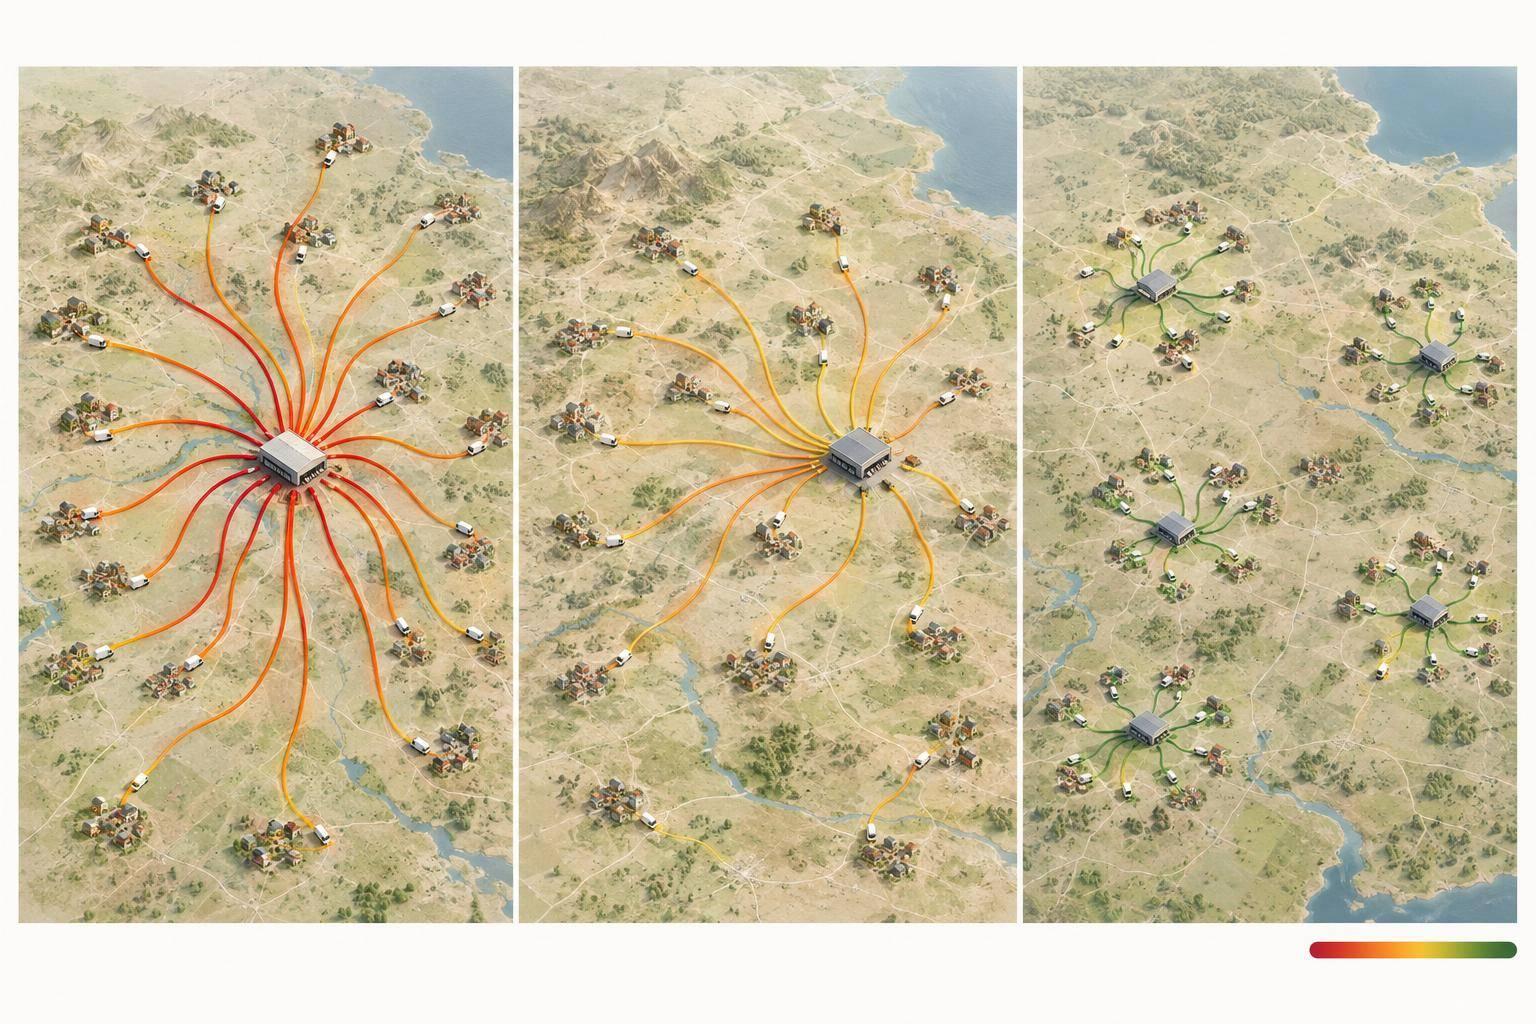
After setting transfer triggers, decide which SKUs to replenish centrally, regionally, or through a hybrid buffer. Pool stock when one node can meet delivery promises. Use daily or weekly order history to check how regional demand moves together and whether peaks overlap. Keep fast movers, protected allocations, and handling-sensitive items regional. Choose a hybrid model when regional base stock needs a central reserve. Promotions or seasonal peaks that happen at the same time limit how much safety stock sharing can help.
Physical pooling is where stock sits. Shared availability is what channels can promise. Reserve wholesale, subscription, promotional, and regional commitments before offering the remaining stock to other channels. Keep node-level availability visible to prevent overselling.
Route Supplier Shipments to Projected Demand
Once stock roles are set, route each inbound shipment to the node that will need it first. Plan around the projected balance at arrival - not the current balance. Use the same forecast, allocation, and lead-time inputs used to set node targets. Add confirmed inbound stock and returns expected to be usable by arrival, then subtract forecast demand and existing allocations. Avoid counting commitments twice.
Check receiving capacity and storage limits. Then compare destination line-haul or parcel-zone costs, along with future transfer costs. Enforce minimum order quantities, case packs, and shipment restrictions. Temperature control, kitting, testing, or white-glove requirements may rule out a cheaper node.
Start with scheduled supplier orders. Let actual orders, cancellations, and returns adjust quantities or destinations before supplier and transportation cutoffs. Set an exception threshold, such as a forecast change above 20% or a projected stockout within the replenishment lead time.
Coordinate Inbound Consolidation and Receiving
After deciding where shipments go, align freight flow, appointment timing, and receiving methods. Use cross-docking for preassigned freight with immediate outbound demand, pool distribution for regional consolidation, and storage when demand timing is uncertain. Assign cross-dock lanes and final destinations before arrival, and align labels, appointments, and receiving confirmation.
Require an advance shipment notice, usually EDI 856, with PO details, quantities, lot or serial data, pallet or carton IDs, and destinations. Give put-away priority to replenishment needed to prevent stockouts, temperature-sensitive goods, and promotional inventory. Send cross-dock freight directly to assigned lanes, and hold items awaiting inspection or testing.
If JIT Transportation supports the network, confirm node coverage, routing rules, system connections, and receiving capability before assigning freight.
Manage Shared Inventory Data and Execution
Assign Decision Owners and Exception Rules
Once stock rules are set, assign an owner to every exception and execution step. Create a responsibility matrix covering forecasts, replenishment parameters, transfers, supplier routing, receiving, inventory adjustments, and priority rules. For each role, document authority, backups, approval limits, and escalation deadlines.
The brand owns forecasts, the 3PL network manager approves transfers, transportation makes service decisions, and warehouse supervisors oversee receiving execution. Require leadership approval for emergency freight, high-value transfers, write-offs, and safety-stock changes. Log each decision’s SKU, node, action, reason, approver, timestamp, and expected service or cost impact.
These owners need one shared record to act on shortages, receipts, and holds. Shared inventory data should drive decisions, not dashboards. Base all replenishment decisions on the same inventory state, including open purchase and transfer orders, expected receipts, ship-to destinations, promised ship dates, and transportation status.
Compare ERP, WMS, order-management, transportation-management, and supplier feeds at least daily. Use near real-time updates for order, shipment, and inventory events when service levels require them. Allocate scarce units based on verified availability, confirmed receipts, arrival dates, customer promises, and service priorities.
Keep uninspected returns unavailable. Route discrepancies through a hold-and-review process, with approved adjustments that can be audited. If a feed is late, use the last validated snapshot and label its age. Pause risky automation and manually confirm scarce stock before promising it.
Measure Network and 3PL Performance
With owners and shared data in place, check whether the network is improving. Give every KPI a formula, data source, owner, and review schedule tied to the shared decision record. Review service exceptions daily and the full scorecard weekly. Report results by node and for the network, using total counts to calculate network-weighted results - not averages of node results.
Use these measurement standards:
- Unit fill rate = units shipped complete ÷ units ordered × 100.
- Order fill rate = orders complete on the first attempt ÷ eligible orders × 100.
- Stockout rate = SKU-location demand lines unavailable at request time ÷ total demand lines × 100.
- On-time replenishment = replenishment orders received by the confirmed date ÷ replenishment orders due × 100.
Also report backordered units and their age, weeks of supply, forecast error and signed bias, annualized inventory turnover, and aged stock. Track transfer cost per unit, emergency freight spend, receiving-to-put-away time, and pickup-to-delivery transit time. Include perfect order rate: the percentage delivered complete, accurate, on time, damage-free, and with correct documentation.
Connect ERP purchase orders and financial records with WMS movements, order-system allocations, and transportation events. For vendor-managed inventory, specify who can authorize replenishment and who is liable for excess stock. Returns management should provide inspected disposition and expected resale timing.
Fulfillment services should report completion and capacity so unfinished kits and goods awaiting testing don't appear ship-ready. Confirm field access, update frequency, error handling, and contractual service commitments - including cutoffs, time zones, exclusions, and escalation contacts.
Conclusion: Build a Repeatable Replenishment Cycle
Use accountable owners and shared data to reconcile inventory, set targets, trigger transfers, route inbound supply, execute receiving, and measure results that guide the next replenishment cycle.
FAQs
How do I set stock targets for new SKUs?
Start planning before inventory arrives. New SKUs have no sales history, so work with brand partners to account for promotions, launches, and seasonal timing. Estimate demand using data from similar SKUs or pooled regional data, then use those estimates to build the initial inbound plan.
Once the SKU is live, review performance weekly or every two weeks. As sales data builds, adjust replenishment thresholds and safety stock levels to match actual demand.
How can I tell if pooling inventory will save money?
Use the square-root law to estimate savings: combining n locations into one typically cuts total safety stock to about 1/√n of its previous level. That frees up cash tied up in inventory.
Next, compare your current decentralized carrying costs - often 20% to 30% of average inventory value - with the potential savings in inventory holding and distribution costs from centralization.
How do I prevent transfers from causing new stockouts?
Keep one real-time inventory source that syncs reservations and commitments across your network. As soon as a transfer is approved, reserve the units at the origin. Mark them as in transit when they ship. Never show the same units as available at both locations.
Before finalizing a transfer, check origin availability and the destination’s receiving capacity again. Feed real-time WMS data into replenishment decisions, and size safety stock using actual lead times.
Related Blog Posts
Related Articles
3PL Models Compared for Reverse Logistics Carbon
3PL Pricing Models Explained for DTC Brands