
Replenishment Planning for Seasonal Demand: Guide
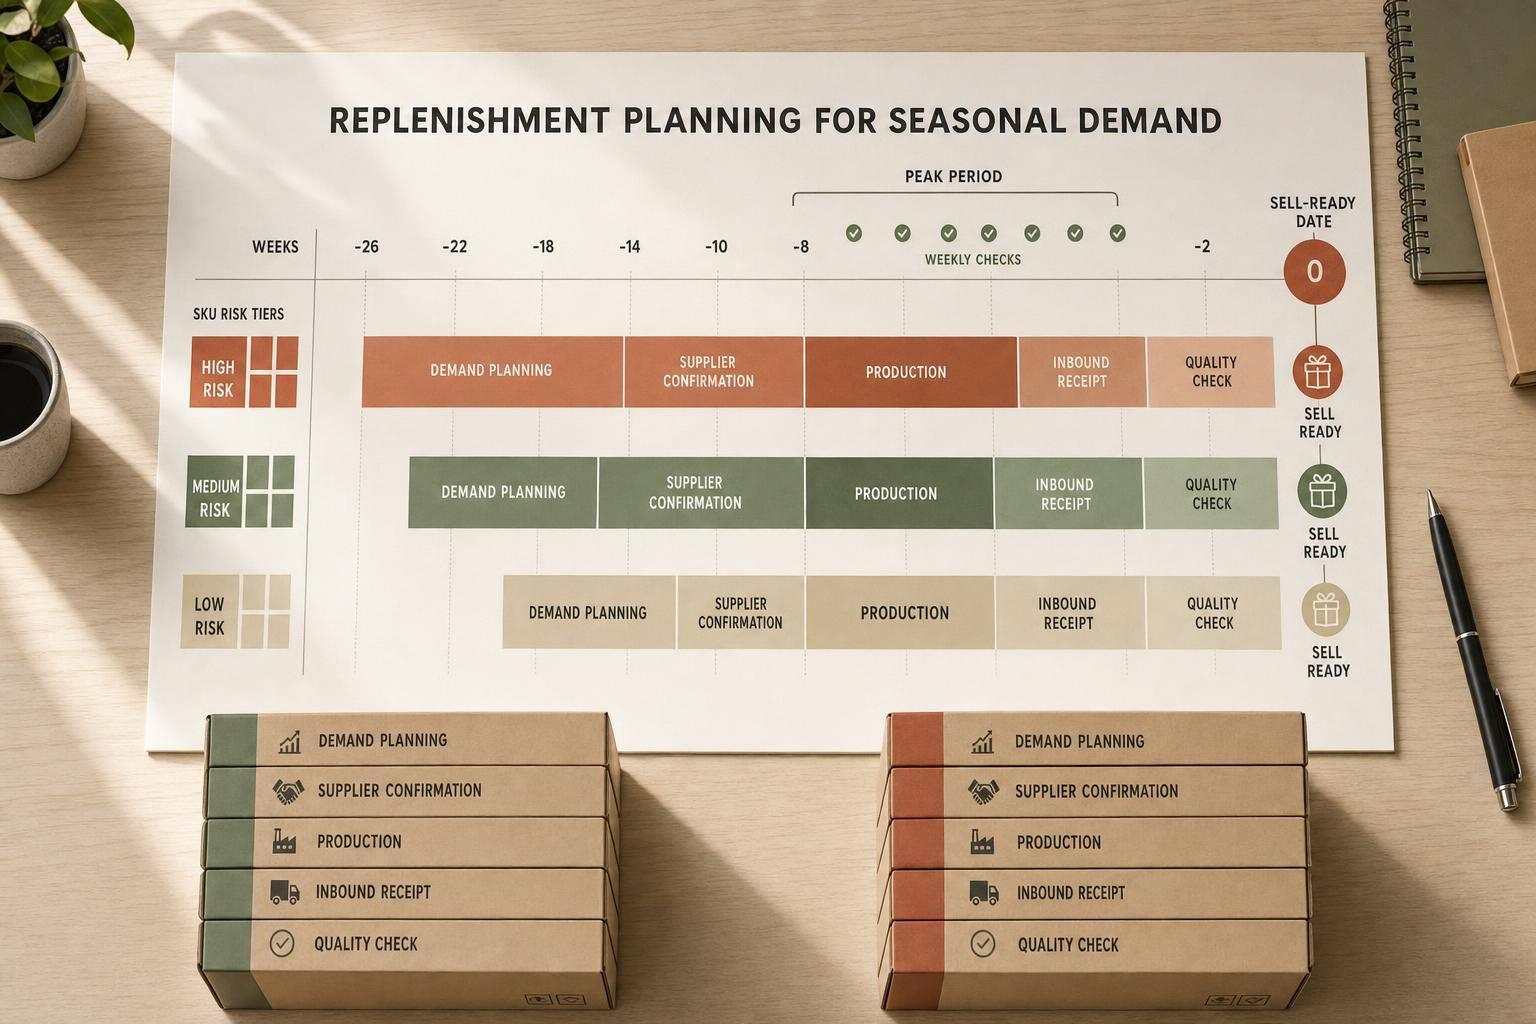
If you wait too long to plan for seasonal demand, you can lose sales on one side and get stuck with extra stock on the other. I’d boil this guide down to one idea: plan backward from the sell-ready date, buy by SKU risk, and check peak performance every week.
For me, the biggest takeaways are simple:
- Place big pre-season orders early when lead times are long, often 90–120 days before peak
- Use weekly SKU and channel forecasts, not broad monthly averages
- Set buys with a basic formula: forecast demand + safety stock - on-hand - confirmed inbound
- Segment SKUs by sales value and demand variation so top sellers get more protection
- Adjust reorder points for peak demand, not normal demand
- Watch weeks of supply closely: under 6 weeks can signal action; over 14 weeks can point to markdown risk
- Protect high-margin channels first when stock is tight
- Match freight, DC timing, dock schedules, and labor plans to the actual peak window
- Review fill rate, ship performance, backlog, and dock-to-stock time each week during peak
A few numbers stand out. Stockout rates sit near 7.9% in the U.S., peak warehouse volume can hit 3x to 5x normal levels, and labor demand may climb 30% to 50%. That’s why seasonal replenishment is not just a buying task. It also affects placement, freight timing, staffing, and channel rules.
If I were setting this up, I’d treat it as a three-part cycle: pre-season planning, in-season control, and post-season review. That keeps the work clear and helps turn last season’s misses into better rules for the next one.
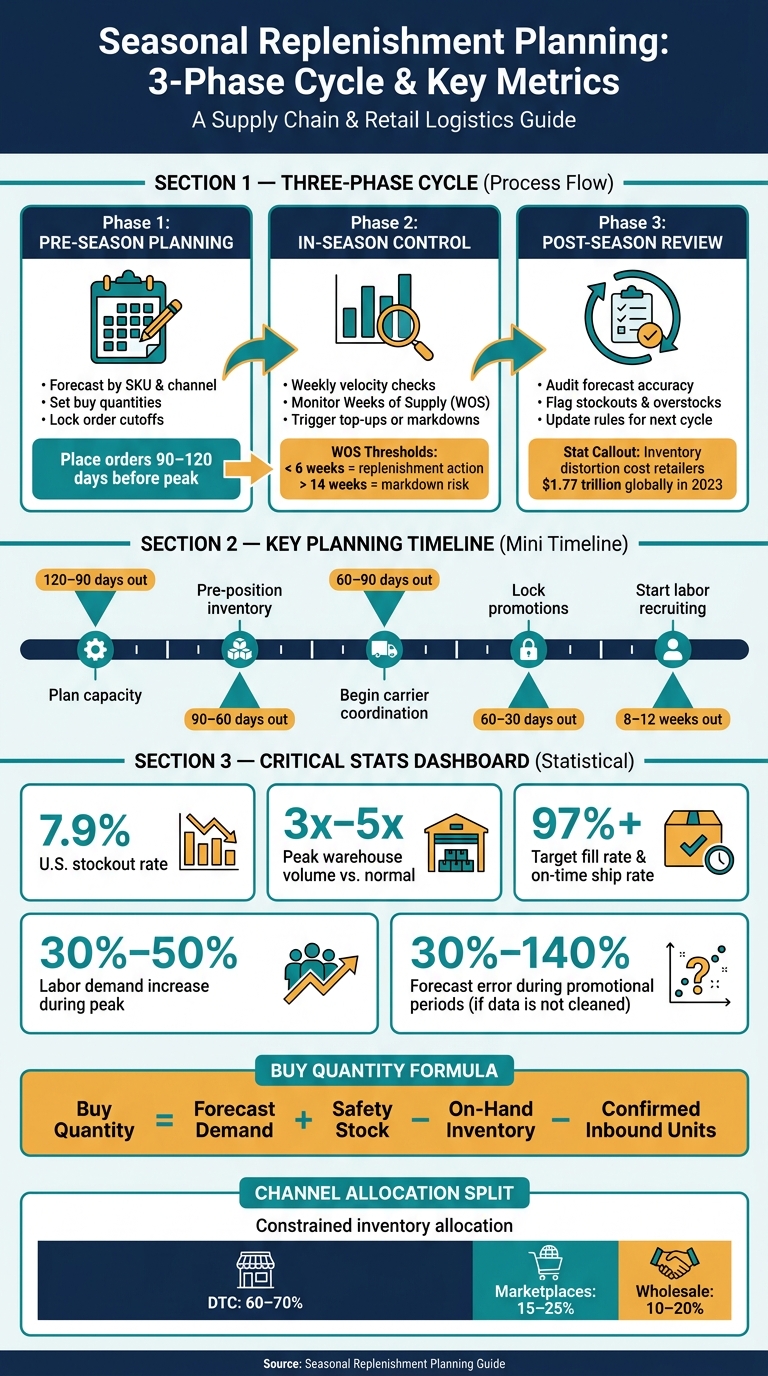
Seasonal Replenishment Planning: 3-Phase Cycle & Key Metrics
Dual Safety Stock & Reorder Point Strategy for Seasonal Inventory (Retail & Manufacturing)
sbb-itb-eafa320
How to Build a Seasonal Replenishment Plan and Timeline
Build the seasonal plan backward from the sell-ready date. That date should drive your buy orders, inbound freight timing, and DC receiving windows.
Pre-Season Planning: Forecasts, Buy Quantities, and Order Cutoffs
Start with two to three years of weekly sales data at the SKU and channel level. Clean it up before you forecast. Remove stockouts, one-off wholesale deals, and other nonrecurring anomalies. Add promotion flags too. If you skip that step, forecast error during promotional periods can run 30%–140% of total sales.
From there, build a weekly demand forecast for the seasonal window. Then split that demand across SKUs and channels based on past sales mix and any planned channel shifts.
Set the buy quantity with a simple formula: forecast demand + safety stock - on-hand inventory - confirmed inbound units.
Then work backward from the DC pick-ready date. For imported goods, lead times often run 3 to 5 months. For domestic goods, they usually run 4 to 8 weeks.
A simple planning rhythm looks like this:
- 120 to 90 days out: plan capacity
- 90 to 60 days out: pre-position inventory
- 60 to 30 days out: lock promotions
In-Season Control: Weekly Velocity Checks and Top-Up Decisions
During peak weeks, check inventory weekly or even twice a week. Focus on the numbers that tell you what’s happening right now:
- sell-through by SKU and channel
- actual versus forecast velocity
- weeks of supply (WOS) at each DC
WOS equals on-hand units divided by average weekly unit sales. If WOS drops below 6 weeks, that points to replenishment or reallocation. If it climbs to 14+ weeks, it’s time to start markdown planning.
Top-ups only work if lead time is shorter than the remaining sell-through window. If demand runs hot, shift inventory and pull back promotions. If demand runs cold, mark down early.
Post-Season Review: Excess Inventory, Forecast Gaps, and Next-Cycle Fixes
Two to six weeks after peak, review what happened. Look at forecast accuracy by SKU, channel, and week. Flag stockouts, overstocks, and lead-time misses.
This matters because inventory distortion - the mix of stockouts and overstocks - cost retailers $1.77 trillion globally in 2023.
Write down each miss and the reason behind it. Then roll those lessons into next season’s forecast, lead-time buffers, and safety stock rules. Use that review to set SKU-level reorder rules and channel allocations for the next cycle.
Set Replenishment Rules by SKU and Channel
Once the forecast is done, turn that demand into clear SKU and channel rules. This is where segmentation helps. Your best sellers stay in stock, and slow movers don’t sit on the shelf tying up cash.
Segment SKUs by Value, Velocity, and Variability
Run two analyses: ABC by sales value and XYZ by demand variability.
For ABC, rank each SKU by annual sales dollars and place it into A, B, or C. A items usually make up the top 70%–80% of total value, B items the next 15%–20%, and C items the bottom 5%–10%.
For XYZ, calculate the coefficient of variation: CV = standard deviation ÷ mean monthly demand over the last 6–12 months. X means low variability (CV ≤ 0.25), Y means moderate variability (0.26–0.50), and Z means highly variable demand (above 0.50).
Then combine the two into a matrix: AX, AY, AZ, BX, BY, BZ, CX, CY, CZ.
That matrix gives you a simple way to set replenishment rules by cluster. An AX SKU in DTC can justify a 97%–99% service level target, 8–12 weeks of peak demand in pre-season buys, and weekly review. A CZ SKU may only deserve a small test buy and no wholesale commitment.
Adjust Reorder Points, Safety Stock, and Seasonal Buys
Set reorder points off peak-season demand, not annual averages. Update them 4–6 weeks before the season starts.
The formula is still straightforward: ROP = average peak daily demand × lead-time days + safety stock.
For an AX SKU, use a higher z-score, around 1.64–2.05, to support a 95%–98% service level. For a CZ SKU, a very small buffer - or no buffer at all - is often the better move.
Your buying approach should match lead time.
- Long-lead imported items with 90–150 day lead times need bigger pre-season builds, usually 70%–90% of expected seasonal demand, because in-season replenishment shows up too late.
- Short-lead domestic items with 20–40 day lead times can use a hybrid plan: pre-build to 50%–70% of expected demand, then top up if demand comes in strong.
Allocate Constrained Inventory Across DTC, Marketplace, and Wholesale
When inventory is tight, channel allocation needs a clear pecking order. DTC usually comes first for high-margin launch SKUs. It gives you strong brand control and, in most cases, the best margin.
A solid starting split is:
- 60%–70% of launch inventory for DTC
- 15%–25% for marketplaces
- 10%–20% for wholesale
Exceptions should need sign-off from finance or sales leadership.
For marketplaces like Amazon, AX and BX SKUs can support dedicated inventory buckets so you don’t lose visibility. CZ SKUs are a different story. When supply is tight, keep those allocations conservative. On the wholesale side, limit guaranteed seasonal programs to A and B class SKUs. C-class items should be offered only as opportunistic or closeout lots, not firm commitments.
If a top SKU sells 25%–30% above forecast in week 1, trigger the rush-replenishment play. Cap marketplace orders or pause replenishment there to protect DTC supply. Keep at least two weeks of DTC cover before releasing extra units to other channels.
Use these SKU and channel rules to steer DC placement, freight timing, and peak-week warehouse capacity.
Align Inventory Placement, Freight Timing, and Warehouse Capacity
Your SKU and channel rules only matter if the physical operation can keep up. In plain terms, inventory has to land in the right DCs, at the right time, with enough space and labor to keep product moving. That’s what turns a forecast into something the team can actually use.
Place Seasonal Inventory in the Right Distribution Centers
The main choice here is simple: run a single-node network or a multi-node network.
A single node is easier to manage and can cut down on split replenishment. But there’s a tradeoff. Customers farther from that building may face longer transit times, and one site can become a choke point during peak.
A multi-node setup can improve delivery speed and lower shipping spend by zone. The catch is that it takes tighter coordination across the network.
For seasonal items, place your fastest-moving SKUs in the nodes closest to demand. Base that decision on demand density, average order destination, and promised delivery speed.
Inside the network, it helps to give inventory clear jobs:
- Primary stock covers baseline demand and serves as the main available-to-sell pool.
- Forward stock sits closer to demand so replenishment moves faster and transit time drops.
- Overflow stock gives you backup when peak volume pushes past planned storage or pick capacity.
Set those roles early. If you don’t, inventory tends to pile into one building, and that’s when congestion starts right when the floor needs to move fast.
Time Inbound Freight to Hit Pick-Ready Dates Without Creating Dock Congestion
Once placement is set, work backward from the sell-ready date, not just the delivery date.
That matters because inventory isn’t sellable the moment it arrives. The full chain often includes production, export, transit, customs, drayage, receiving, and putaway. Every step eats up time. One delay can shrink the whole window.
For peak seasons, one logistics planning guide recommends starting carrier coordination 60–90 days out and labor recruiting 8–12 weeks ahead, or 12–14 weeks in competitive markets. The goal is to land inventory early enough to receive it, slot it, and make it available before demand jumps.
Dock congestion is one of those problems that sounds minor until it wrecks the week. It usually shows up when too many trucks hit the dock on the same day, late freight squeezes the receiving window, or missing paperwork slows everything down.
The fix is usually not fancy. It’s staggered arrivals. Spread inbound freight across several days before a major event like Black Friday instead of forcing everything into one tight window. Line up appointment scheduling and receiving cutoffs with your 3PL early. Then push high-velocity SKUs to the front so pick faces get stocked before the rest of the freight is put away.
Plan Labor, Slotting, and Internal Replenishment for Peak Weeks
Peak weeks in Q4 can run at 3–5x normal volume, and labor demand can climb 30%–50% above normal. That kind of jump puts uneven pressure on the warehouse, especially when promo volume, kitting, and returns all hit at once. So the staffing plan can’t be an afterthought. It has to come from the forecast.
Break the forecast into workload by function: inbound receiving, putaway, internal replenishment, picking, packing, and returns processing. Estimate units per hour for each task, compare that with expected daily volume, and leave room for holiday absenteeism and training time. Cross-training helps a lot here because workers can shift between receiving, replenishment, and pack-out as demand changes day by day.
Slotting needs the same kind of forward planning. Move seasonal fast movers into the easiest pick faces before volume ramps up, not in the middle of the rush. And don’t base slotting on annual averages. Use forecasted peak velocity instead. A holiday gift set that barely moves in July may deserve prime golden-zone placement in November.
Internal replenishment should run off demand-based thresholds, not fixed calendar timing. Set a minimum pick-face level for each high-velocity SKU. When available units drop below the next few hours of forecasted demand, trigger a reserve stock move. That keeps pick lines moving without forcing the team to watch every location by hand.
A 3PL with transportation, fulfillment, and value-added services helps keep peak-season flow moving. But even then, these rules only hold up when your 3PL systems and weekly operating cadence keep them current.
Use 3PL Systems and Operating Cadence to Improve Each Peak Season
Tools That Support Seasonal Replenishment Execution
Once the seasonal plan is locked in, execution moves into the systems. During peak, four systems handle the heavy lifting: WMS, OMS, TMS, and demand planning tools. They turn demand forecasts, channel priorities, and DC placement into day-to-day decisions.
The WMS tracks inventory by location, triggers internal replenishment when pick faces run low, and flags exceptions such as negative on-hand counts and bin variances.
The OMS applies channel-priority rules in real time as inventory shifts.
The TMS handles carrier selection, appointment scheduling, and shipment tracking.
Demand planning tools should produce base, high, and stress scenarios by SKU and channel. From there, they should turn those scenarios into recommended buy quantities, safety stock levels, and slotting priorities.
Of course, systems alone don't fix much. They only help when the team reviews them on a set cadence.
Operating Cadence with a 3PL During Peak Season
That cadence needs to start before peak, not in the middle of the rush. Begin weekly reviews 120–90 days before peak. Hold the pre-season alignment meeting 4–8 weeks before peak. Bring in leads from supply chain, demand, channel, operations, and transportation. Review the promotional calendar, confirm inventory arrival timing by DC, line up labor plans, and agree on service-level targets and escalation paths.
During peak, weekly joint reviews keep both sides on the same page. The discussion should cover fill rate, on-time ship rate, backlog, days of supply, dock-to-stock time, and productivity. These reviews should also check whether actual sell-through still matches the plan. During Cyber Week, move to daily stand-ups centered on yesterday's performance, today's inbound schedule, and any critical exceptions.
Target on-time ship rate and fill rate above 97%. If those numbers start to slide, the cadence should trigger action right away: shift labor, expedite an inbound load, or throttle a channel.
JIT Transportation supports this setup through WMS and OMS integrations that connect commerce platforms and ERP systems, giving planners near-real-time visibility across fulfillment nodes.
Conclusion: Core Steps That Reduce Seasonal Stock Risk
The brands that manage peak season well tend to follow the same pattern. They start planning early, segment SKUs before setting buy quantities, place inventory in the right nodes, align inbound timing with warehouse capacity, and use system visibility plus regular operating reviews to adjust when peak season moves off plan.
Handled in order, those steps reduce seasonal stock risk and improve control during peak. The brands that win peak season pair planning discipline with tight execution.
FAQs
How do I choose safety stock for seasonal SKUs?
Start with a baseline from 12 to 24 months of order history. Look at daily demand, and look at how much lead times bounce around. A common method is to multiply your service factor by demand variability during lead time.
For peak seasons, adjust your buffer based on historical sales uplift instead of applying the same increase across the board. That gives you a buffer tied to what actually happened, not a guess.
It also helps to plan for worst-case lead times, especially if suppliers don’t always deliver on the same schedule. And don’t treat every SKU the same. Segment them so top sellers or high-margin items carry more safety stock, while trend-sensitive products stay leaner to cut the risk of sitting on stock that goes stale.
When should I use rush replenishment during peak?
Use rush replenishment during peak when your base inventory and planned buffers can’t cover an unexpected demand spike and you’re close to a stockout.
This should be a reactive move, not your main plan, because expedited shipments usually come with premium costs. Your first line of defense should be planning ahead, like increasing safety stock 6–12 weeks before peak, so you’re less likely to need last-minute replenishment.
What metrics matter most during seasonal peak weeks?
During seasonal peak weeks, focus on the metrics that keep service levels steady and the floor moving:
- Order accuracy: 99.5% or higher
- Same-day ship rate: above 95% for orders placed before cutoff
- Receiving turnaround for peak-critical SKUs: under 24 hours
- Pick rates per labor hour
- Inventory accuracy
These numbers act like an early warning system. They help you catch bottlenecks before they turn into missed shipments, slower receiving, or stock issues. That gives you time to shift labor, adjust priorities, and keep overall performance on track.
Related Blog Posts
Related Articles
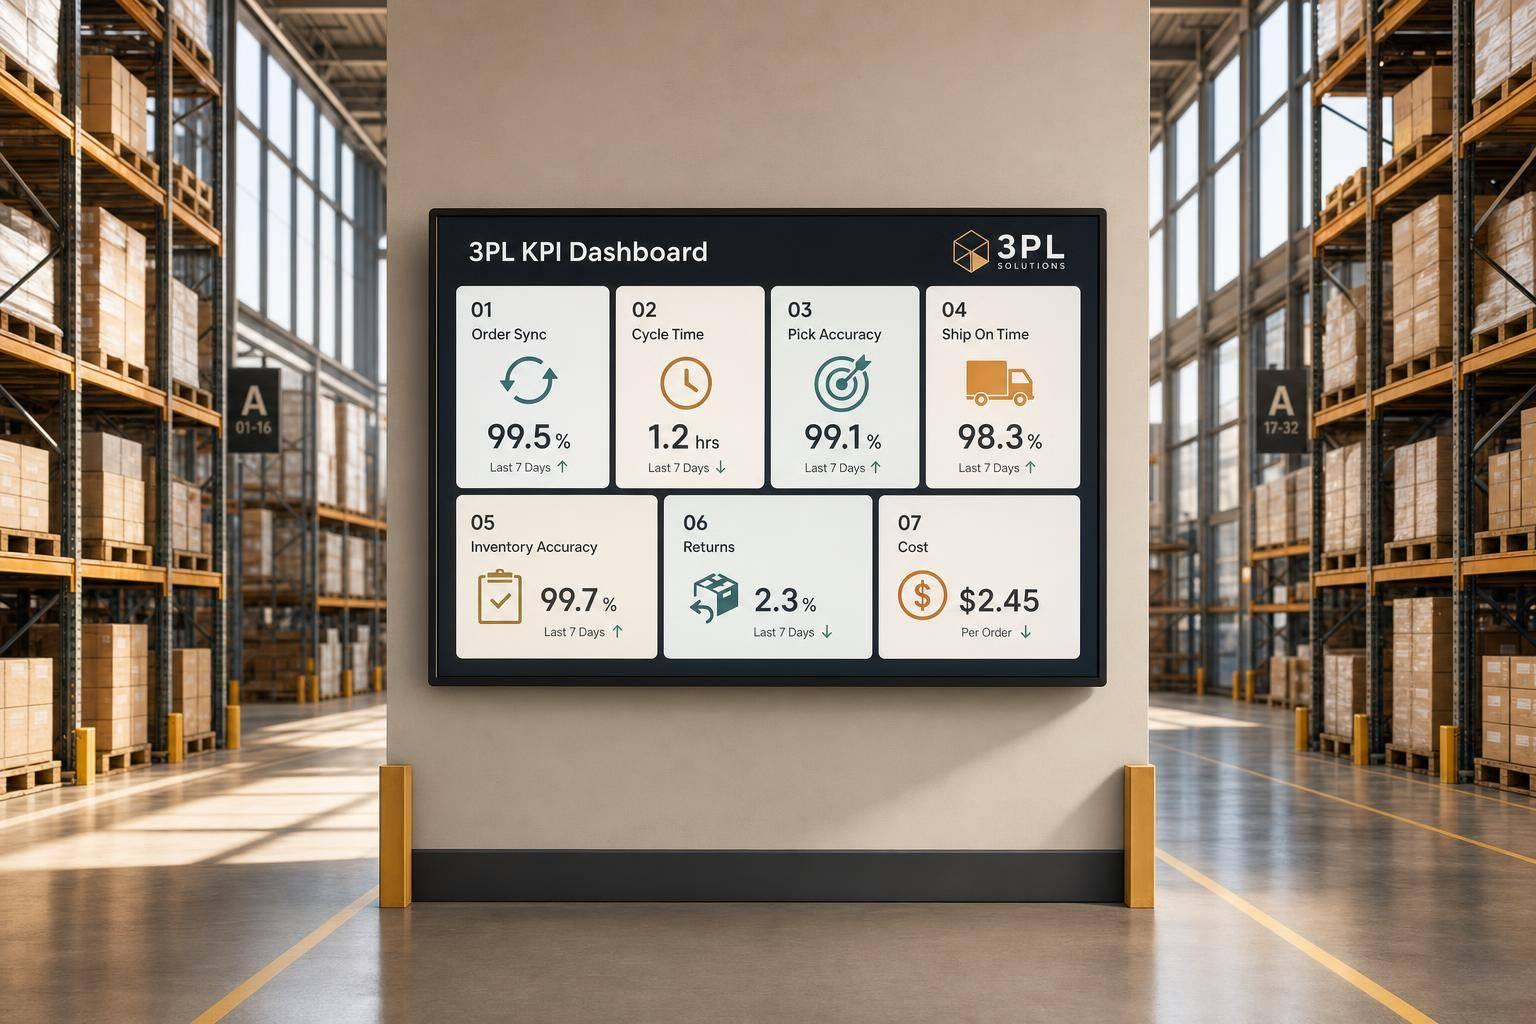
7 WooCommerce 3PL KPIs Teams Track

Centralized vs Decentralized Replenishment
