3PL Warehouse Automation: Guide for Fast Growth
If your brand is shipping 3,000+ orders a month, manual warehouse work can start costing you fast. At that point, paper pick lists, manual label entry, and weak location control can lead to more mis-picks, slower receiving, missed carrier cutoffs, and higher cost per order.
Here’s the short version: 3PL warehouse automation uses barcode scans, WMS rules, sortation, carton logic, and pack-station controls to cut errors and keep orders moving. For many U.S. DTC and B2B brands, the main goal is simple: ship more orders with fewer touches and fewer mistakes.
What I’d take from this guide:
- Barcode scanning is the starting point. It ties each SKU, bin, and movement to the WMS.
- The WMS is the control layer. It connects inventory, orders, labels, returns, and ERP data.
- DTC and B2B need separate flows. Parcel orders and retail-compliance orders should not run the same way.
- Cartonization and sortation cut waste and delays. Better box choice can lower DIM charges and corrugated use.
- Rollout should start small. Clean SKU and location data first, then test one client, one zone, and a limited SKU set.
- KPIs tell you if it’s working. Watch order accuracy, on-time shipping, inventory accuracy, dock-to-stock time, return speed, scan compliance, and cost per order.
A few numbers stand out:
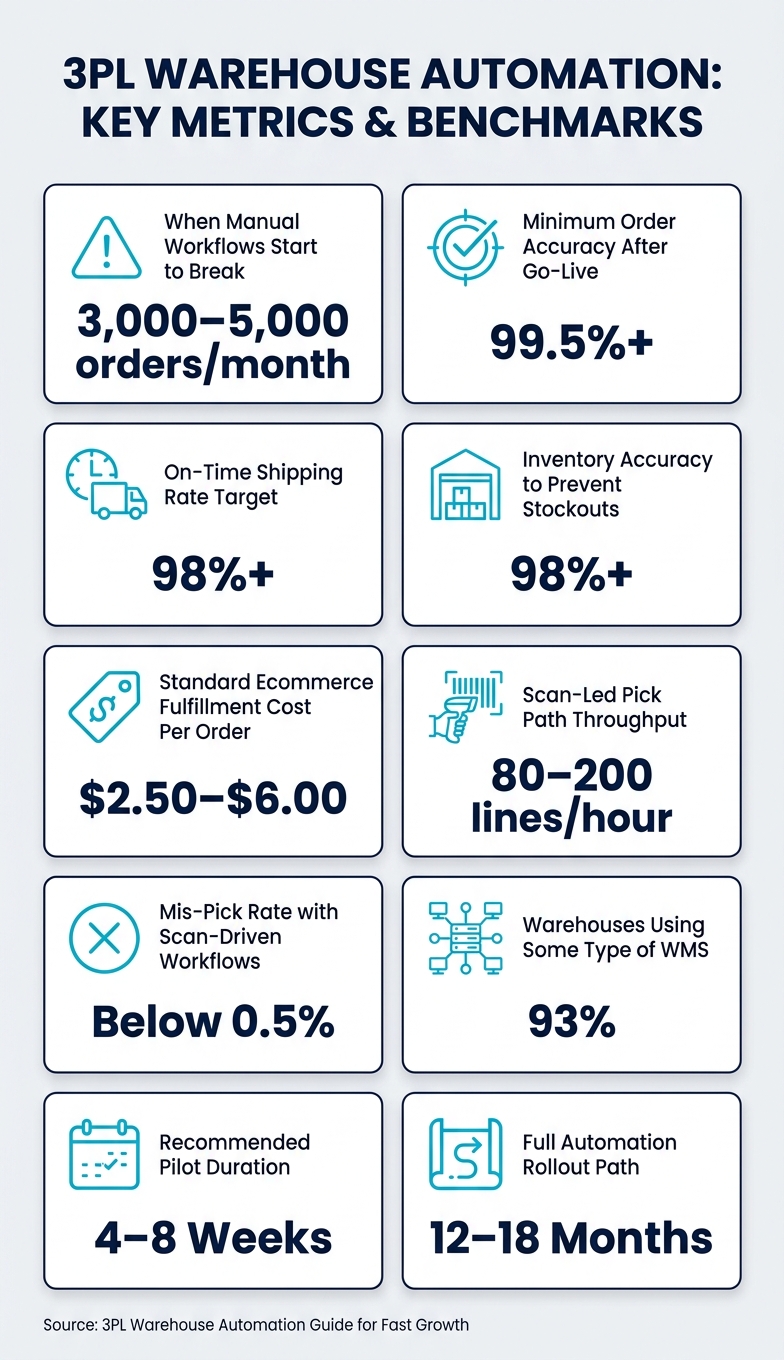
- 3,000 to 5,000 orders/month is often where manual workflows begin to strain
- 99.5%+ order accuracy is a common floor to watch after go-live
- 98%+ on-time shipping is a common target
- 98%+ inventory accuracy helps prevent stock errors
- Standard ecommerce fulfillment often aims for $2.50–$6.00 per order
- Scan-led pick paths can reach 80–200 lines per hour, based on SKU mix and density
The big idea is simple: start with data, build around scan-based process control, split DTC from B2B logic, and expand in phases. That’s how I’d look at automation if the goal is growth without more warehouse chaos.
3PL Warehouse Automation: Key Metrics & Benchmarks
Core automation systems in a 3PL warehouse
Barcode scanning and location control
Barcode scanning sits at the center of receiving, putaway, picking, packing, and shipping. Every SKU and every warehouse location gets its own barcode ID, and the WMS logs each move between them. When a unit is received, put away, picked, packed, or shipped, that scan is tied to a timestamp, a user ID, and a location. That gives you full traceability.
The logic is simple: scan the item, scan the destination, and stop the transaction if the SKU, quantity, or bin doesn't match. That way, the error gets caught before it turns into a bigger downstream mess. In day-to-day use, these scan-driven workflows can push mis-picks below 0.5%.
The hardware usually includes:
- Rugged handheld RF scanners
- Wearable ring scanners linked to mobile devices
- Fixed-mount scanners on conveyors
- Industrial scales
- Label printers at pack stations
That setup covers each movement stage without dragging down throughput. As order volume grows, scan discipline keeps inventory, orders, and labor in sync across both DTC and B2B work.
That accuracy then feeds the next steps: sortation, carton choice, and pack-station routing.
Sortation, cartonization, and pack station workflow
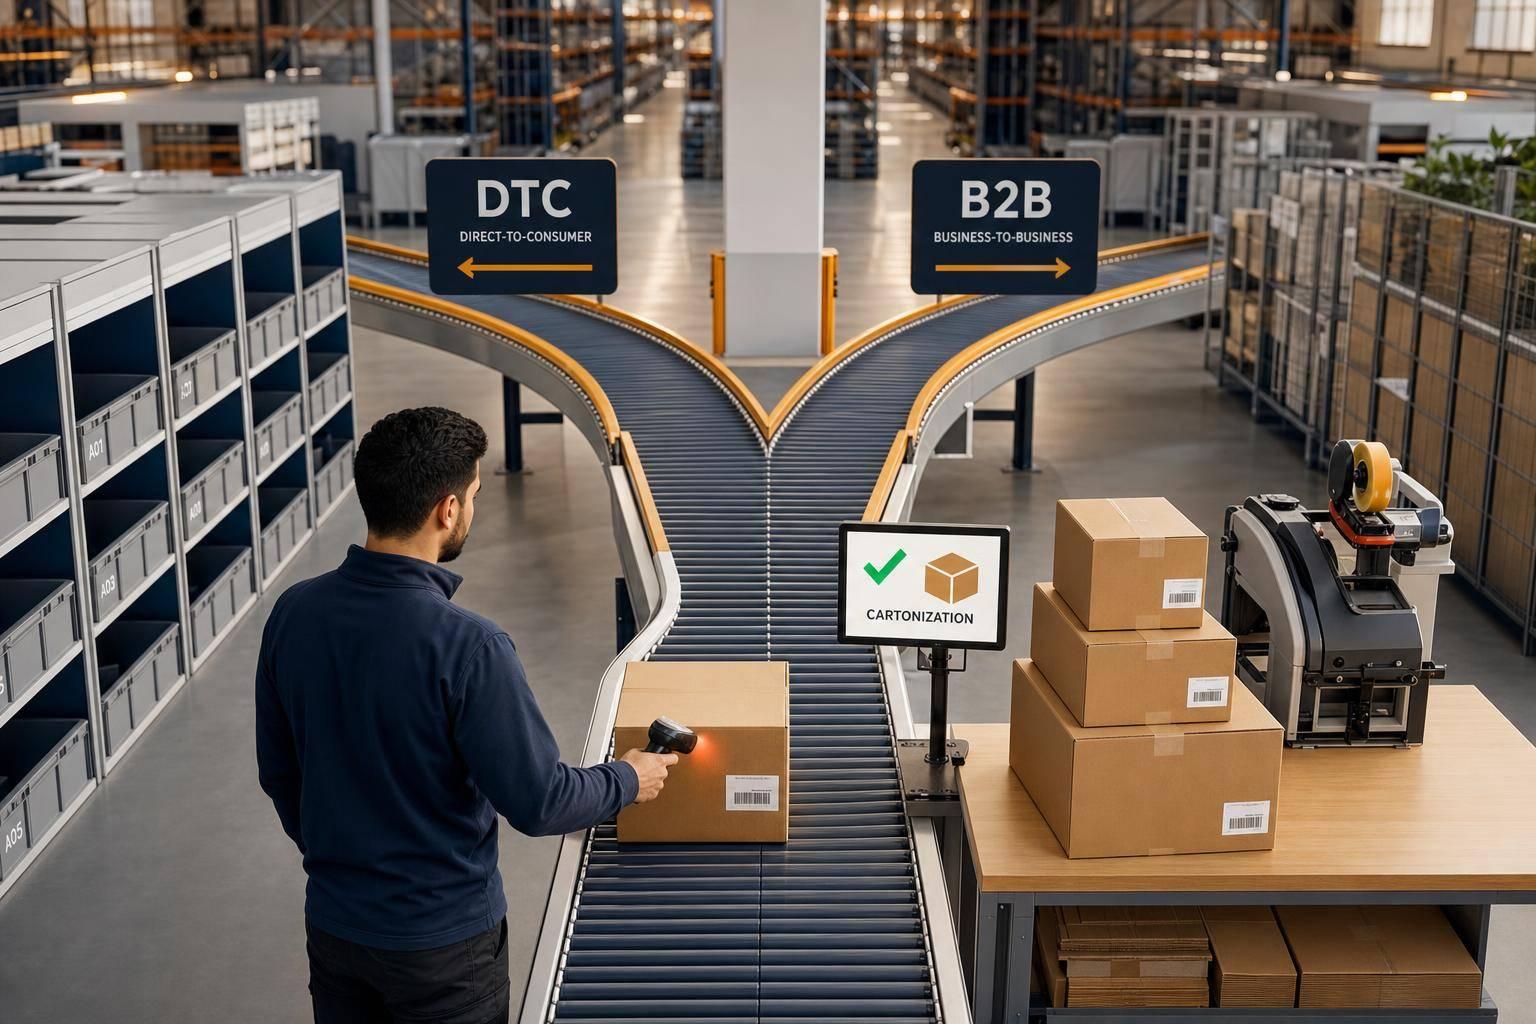
After packing, sortation sends each carton to the right outbound lane based on carrier, service level, client, or channel. Fixed-mount scanners on the conveyor read the carton barcode and trigger diverters, such as pushers, shoes, or swivel wheels, to move it to the right chute. Since routing rules live inside the WMS instead of paper SOPs, teams can change them fast when carrier deals or client specs shift. Parcel orders and compliance-heavy B2B orders need different routing logic, so that split has to be built into the setup from day one.
Cartonization helps cut DIM weight and corrugated waste. The WMS, or a packing engine tied to it, reviews each order's item dimensions, weights, and packing rules, then picks the smallest box or mailer that will work. KAO Brands cut transportation costs 5.9%, corrugated use 33%, and net DIM weight 34%. Daily Harvest reported five-figure monthly savings across 3,645 of 23,857 orders.
Pack stations also need a clear split between DTC and B2B flows. DTC stations focus on SKU accuracy, brand presentation, and carrier labels. B2B stations add case labels, packing lists, and BOLs to meet retailer rules. If those steps get missed, chargebacks tend to show up fast. Put both workflows at the same station, and things usually slow down while compliance risk goes up.
Those workflows only hold together at scale if the WMS updates orders, inventory, and labels right away.
WMS integration as the control layer
The WMS is the control layer. It ties together orders, inventory, labels, and returns in real time. Without those links, scanning, sortation, and cartonization each do their own job but stay cut off from one another. With them in place, one scan at receiving can kick off putaway tasks, update storefront inventory, and change wave plans for the next pick cycle.
For B2B clients, ERP integration matters a lot. Inbound POs and ASNs need to be inside the WMS before freight arrives so receiving can check shipments against expected data. Then outbound shipment confirmations and inventory adjustments flow back to the ERP, which keeps finance and planning records in line. When ERP and VMI are connected, live sales and inventory data can trigger replenishment, adjust safety stock, and improve slotting. That data reliability is what makes more advanced automation, like dynamic slotting and labor forecasting, work the way it's supposed to.
One automation-focused survey notes that 93% of warehouses use some type of WMS. The big difference is whether those systems share one live source of truth or run as separate tools.
Once that control layer is steady, rollout speed becomes the next bottleneck.
sbb-itb-eafa320
How to design automation for DTC and B2B growth
With scanning and a WMS already in place, the next step is to design automation around how DTC and B2B orders actually move through the warehouse.
Map current workflows and find bottlenecks
Before you buy equipment or change your WMS setup, walk through each major workflow from start to finish. Follow every step, note every handoff, and document how work gets completed - whether that happens through a scan, a system status, or manual input.
You want a process map that lays out tasks, handoffs, and tools across receiving, putaway, allocation, picking, packing, loading, and returns. After that, build at least a one-week baseline using your own data: throughput per hour by step, average cycle time, queue length before each step, and labor use. If a step keeps building a queue, stays flat on output, or runs close to 100% capacity while the next team waits around, that's your bottleneck.
Common places to automate include:
- Paper pick lists
- Unscanned put-away
- Manual carton size selection
- Manual shipping label entry
- Spreadsheet-based allocation
These steps tend to add delays, mistakes, or both.
Once the map is done, the split between DTC and B2B should be easy to spot. That matters because you need to separate that logic before you model labor or equipment.
Separate DTC parcel flows from B2B compliance flows
DTC is usually high-volume and driven by SLAs. B2B is a different animal. It comes with channel-specific rules for labels, pallet patterns, paperwork, and appointment scheduling before the shipment can even leave.
B2B orders often come in as EDI 850 purchase orders. They may need GS1/UCC-128 case labels, retailer-specific routing guide rules for pallet setup and carrier choice, and an ASN (EDI 856) sent before the truck departs. Miss one of those steps, and chargebacks can eat into both the brand's margin and the 3PL's margin.
A simple way to handle this is to run separate waves in the WMS for each channel. DTC waves are usually short and frequent - often every 30–60 minutes - and timed to carrier cutoffs. B2B waves should line up with truck appointments and routing instructions. When volume is high enough, separate pack-and-ship zones can also help. Mixing parcel stations with pallet-build lanes tends to create congestion and preventable errors.
Use WMS rules to automate labels, documents, carrier selection, and appointment handling for both DTC and B2B.
Build the labor, capacity, and cost model
Once the channel split is clear, turn the workflow into a labor and cost model.
Start with three data sets: order volume, product profile, and current performance. That means looking at orders per day, lines per order, units per line, channel mix, and seasonality. Then add SKU count, velocity tiers, cube and weight, and storage media. Finally, pull in current operating rates like receiving pallets per hour, picks per line per hour, orders packed per station per hour, and dock-to-stock time.
From there, calculate cost per order by dividing total warehouse operating cost by orders shipped, with a separate view by channel. Well-run U.S. ecommerce 3PLs often aim for $2.50–$6.00 per order for standard pick-and-pack fulfillment. And layouts with scanning plus directed pick paths often hit 80–200 lines picked per hour, depending on SKU count and pick density.
Once you have those baselines, add the productivity lift from your mapped process and recalculate labor hours, staffing needs, and cost per order. That side-by-side view of the current state and future state is what turns ROI from a guess into something you can actually defend.
Rollout plan: from pilot to full 3PL automation
Start with data cleanup and a narrow pilot
Once barcode rules, cartonization, and WMS logic are set, the rollout should begin with clean data and a tight pilot.
Start there before touching the WMS or equipment. A SKU master audit should come first. Check that every active SKU has:
- a unique identifier
- a clear description
- the right unit of measure
- a current status
Duplicate or stale SKUs are one of the most common reasons mispicks show up after automation goes live.
Next, standardize barcodes across the active SKU catalog. Then re-measure the top 20–30% of SKUs by shipped volume to confirm dimensions and weight. If those numbers are wrong, cartonization logic starts to fail, and sortation equipment can jam.
After that, audit bin and location naming. Every rack, shelf, and bin code in the WMS should match the physical label on the floor. The structure should follow a clear zone–aisle–bay–shelf–bin hierarchy. At the same time, set launch baselines for:
- pick accuracy
- lines per labor hour
- order cycle time
- dock-to-stock time
Once the data is in good shape, keep the pilot narrow. Start with one low-risk client, one zone, and the top 20–30% of SKUs by shipped lines. Run the pilot for four to eight weeks during an off-peak period. That keeps the blast radius small if something goes wrong, while still giving you enough order volume to spot integration problems before they hit the rest of the client base.
Test WMS links, cut over carefully, and train the floor
Integration testing is where a lot of automation projects go sideways without much warning.
Before go-live, document every field mapping between the WMS and connected systems, including ERPs, shopping carts, carrier systems, and equipment controllers. That means order-level fields, line-level fields, and inventory status fields all need to be mapped and checked in a sandbox environment. Test standard orders, partial shipments, and carrier changes.
After sandbox testing, move to a staged cutover. Start with one shift and only part of daily volume, around 20–30% of DTC orders. Decide on rollback criteria before the switch happens:
- Pick or pack accuracy dropping below 99.5%
- On-time ship rate falling more than 10–15% below baseline
- Exception queues that cannot be cleared the same day
Training matters just as much as system setup. Associates need practice with scan prompts, exception screens, and task sequencing. Classroom briefings help, but supervised floor sessions using live or test orders are where the process starts to stick.
Supervisors should have dashboards that show real-time order backlogs, pick and pack throughput, and exception queue aging. It also helps to run daily standups for 30 days. That gives the team a way to catch setup problems early and correct behavior before bad habits settle in.
Expand by process, site, and service line
Once the pilot is stable, expand in a simple order: process first, then site, then service line.
Use WMS tasks and scan events to move into cycle counting, returns, and interfacility transfers. A good next step is scan-based cycle counting. System-directed cycle counts can improve inventory accuracy and cut the need for full physical inventory shutdowns.
Returns processing usually follows. Scan inbound items against original orders, then send them through WMS-defined disposition workflows such as restock, rework, scrap, or secondary channels. That cuts manual data entry and speeds up refund cycles.
For multi-site operations, interfacility transfers are the next target. The barcode standards and data structure work from earlier phases pays off here. It makes inventory visibility across locations easier to keep up and helps prevent inventory from getting lost in transit between facilities.
After that, kitting, testing, and white glove workflows can move into the automated setup as well. WMS tasks and scan events can guide each step and keep traceability in place from start to finish.
This 12–18 month path - process by process, then site by site, then service line by service line - is how a 3PL can scale automation without overloading the operation. Use the launch baselines above as the KPI scorecard in the next section.
KPIs that prove automation is working
Core warehouse and service KPIs
Once rollout is done, the next step is simple: check whether the system is making the operation better. After go-live, track the KPIs below to confirm fewer errors, faster movement, and stronger margin.
Seven core metrics matter most: order accuracy, on-time shipping rate, inventory accuracy, dock-to-stock time, fulfillment cycle time, return processing time, and cost per order.
Order accuracy is the most visible metric. Calculate it as error-free orders divided by total shipped orders. Track it by client, site, channel, and service type. If it drops below 99.5%, it needs attention.
On-time shipping rate shows whether orders leave within the promised cutoff or SLA window. For most DTC and B2B operations, that rate should stay at 98%+.
Inventory accuracy should remain at 98%+ to help avoid stockouts and oversells. Dock-to-stock time measures how fast received product becomes available for picking. That matters because brands can only sell newly arrived inventory once it's live in the system.
Fulfillment cycle time tracks the time from order release to shipment confirmation. Return processing time shows how fast returned items move through inspection and back into available stock.
Then there's cost per order (CPO). This is total fulfillment cost divided by shipped orders. Track it by channel and order complexity, and expect it to drop as touches decrease and carton selection gets tighter. Review CPO on its own for DTC parcel flow and B2B compliance flow, since those two models have different cost and service patterns.
These KPIs show the outcome. The next set shows what's happening inside the process.
Automation-specific productivity KPIs
Scan compliance is the clearest sign of process discipline. It measures the share of required scans completed across receiving, putaway, picking, packing, and shipping. Track required scans by workflow step, shift, and associate.
Units per labor hour shows whether automation is lifting throughput. Compare pre-automation and post-automation units per labor hour to measure the gain. From there, look at downstream flow metrics like:
- Pack station orders per hour
- Average pack time per order
- Carton utilization
- Dimensional-weight savings
- Sortation throughput and accuracy
These numbers help show whether the pack and ship side is keeping up.
Rework rate matters too. This measures orders that need manual correction or extra touches. It's the hidden cost of mistakes that scan compliance and WMS validation are meant to stop.
For fast-growing brands, seasonal peak capacity uplift shows how much more volume the warehouse can handle without matching labor growth. Compare baseline throughput, peak throughput, overtime hours, and service metrics during Q4 or promotion spikes. When automation is doing its job, the site handles more volume with less chaos, fewer exceptions, and lower reliance on temp labor.
Conclusion: the shortest path to scalable fulfillment
When these metrics improve together, the picture is pretty clear: automation is working. Fast-growing U.S. DTC and B2B brands need systems that match their actual order mix, compliance demands, and peak-volume patterns, not off-the-shelf warehouse tech that looks good in a demo.
When speed, accuracy, and cost per order all move in the right direction across both DTC and B2B flows, automation has done what it was supposed to do. A 3PL partner like JIT Transportation can help support scalable operations with fulfillment, transportation, and value-added services such as pick & pack, kitting & assembly, testing, and white glove handling.
FAQs
How do I know when my 3PL needs automation?
Consider automation when manual workflows start to drag down performance. You’ll usually see the warning signs first: bottlenecks, more errors, missed SLAs, or staffing pressure during seasonal spikes.
Automation can improve speed and consistency. But there’s a catch. If the process is messy to begin with, automation may just make that mess happen faster.
That’s why it’s smart to standardize workflows first and use data to guide the decision before you invest.
What should I automate first in a warehouse?
Start by automating accurate, real-time data collection with scan-based workflows. That means moving away from paper notes and memory-driven steps. If every inventory move requires a scan, your team gets cleaner data from the start.
That part matters more than it may seem. Automation won’t fix poor slotting, billing errors, or bad data. If the inputs are off, the system just moves those mistakes along at scale.
Once your data is reliable, focus automation on the areas where SLAs tend to break down most often. For example, you can tighten up receiving with dock scheduling and point-of-receipt labeling. Or you can improve accuracy with guided mobile picking and pack verification.
How long does a 3PL automation rollout take?
A 3PL automation rollout usually happens in stages, so the timeline depends on how complex the project is.
For a simpler setup, implementation may take around 90 days. More involved projects often take 4 to 5 months.
Some parts of automation can start paying off much sooner. For example, order routing may show results within 6 weeks.
Full-facility automation takes more time. In many cases, it rolls out in phases over 3 to 5 years.
Related Blog Posts
Related Articles
Real-Time Analytics for Goods-to-Person Workflows

How 3PL Partners Share Supply Chain Risk