Real-Time Analytics for Goods-to-Person Workflows
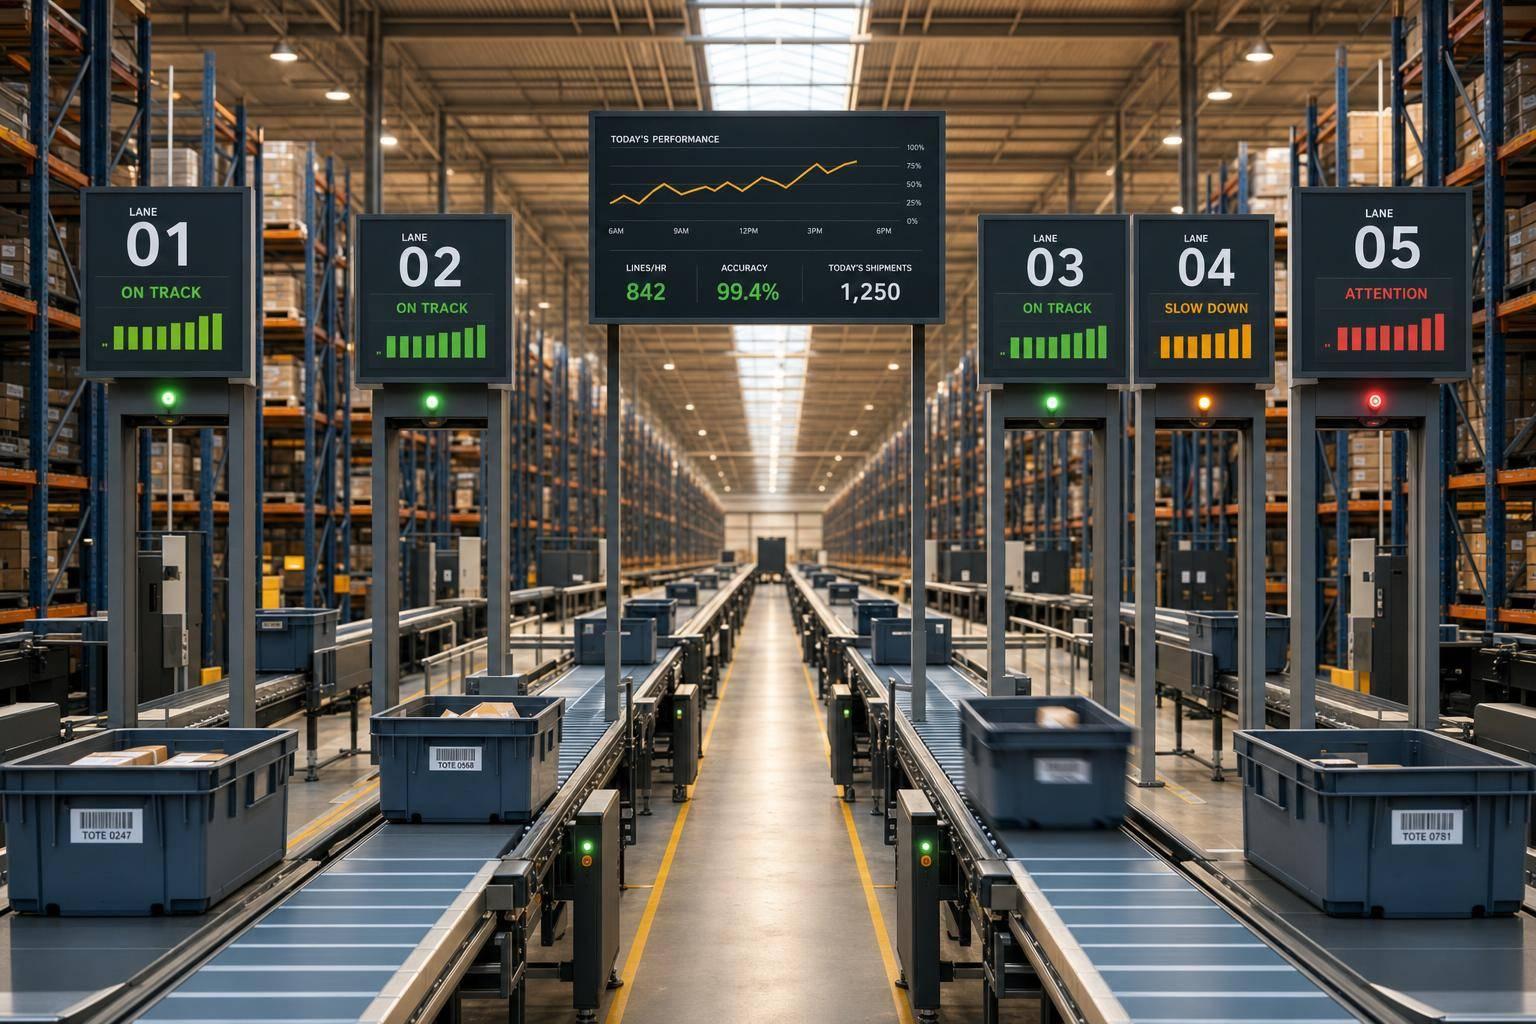
If your warehouse team sees a problem 30 minutes late, the damage is already done. In goods-to-person fulfillment, the fix is simple: track the right live signals, show them by lane, and tie each alert to a clear floor action.
Here’s the short version:
- Track one clean event stream across orders, inventory, labor, and machines
- Watch the floor by workflow: picking, replenishment, packing, and exceptions
- Use live thresholds for queue depth, dwell time, tote wait, stockout risk, and SLA age
- Set response rules like:
- move labor when pack dwell time tops 30 minutes
- step in when projected on-time ship rate drops below 97%
- trigger urgent replenishment at 60 to 90 minutes of remaining demand
- Measure both shift health and business results, including:
- ≥99.5% order accuracy
- >98.5% on-time shipment rate
- <3% exception rate
What I take from this article is straightforward: live analytics only matters if it helps someone act within minutes. That means clean timestamps, lane-level dashboards, low-noise alerts, and shift reports that connect floor decisions to throughput, labor use, and same-day shipping performance.
If you run a high-volume DTC operation, this is the core idea in one line: see bottlenecks early, assign labor fast, and keep every lane working off the same data.
Real-Time Analytics KPIs for Goods-to-Person Warehouses
Beyond Picking Rates: Total Warehouse Optimization with Goods-to-Person Solutions
sbb-itb-eafa320
What real-time analytics must track in a goods-to-person system
Before live metrics can guide work on the floor, the system needs one thing first: a clean event stream. That event layer powers the live metrics teams use to manage picking, replenishment, packing, and exceptions.
Order, inventory, and workflow event data
The base of any goods-to-person analytics system is a continuous event stream. Every meaningful action in the warehouse should create a timestamped record: order released, tote arrived, item confirmed, short pick created, replenishment requested/completed, pack scanned/completed, hold created, exception opened/resolved, and order closed.
Each event also needs a consistent set of fields. That usually includes order ID, order status, SKU, quantity, location, wave or release ID, station ID, associate ID, device or robot ID, event type, and a unique event ID. With that structure, the analytics layer can rebuild the full lifecycle of an order, tote, or SKU without blind spots.
It should also keep a standardized source system plus both an event timestamp and an ingest timestamp. Inventory state needs tracking at the location level, not just the SKU level. That means on-hand quantity, reserved quantity, allocated quantity, available quantity, and the exact bin or tote identity tied to the item. Without that detail, short-pick and replenishment alerts can go sideways fast.
Timestamp accuracy matters just as much as event coverage. Metrics such as queue time, station dwell time, pick cycle time, replenishment response time, pack lag, and exception aging all come from the gap between two timestamps. If those timestamps are missing or inconsistent, the numbers stop helping and start adding noise.
Labor signals and machine signals
Once the event stream is set up, the analytics layer has to bring in two different groups of performance signals and show them side by side.
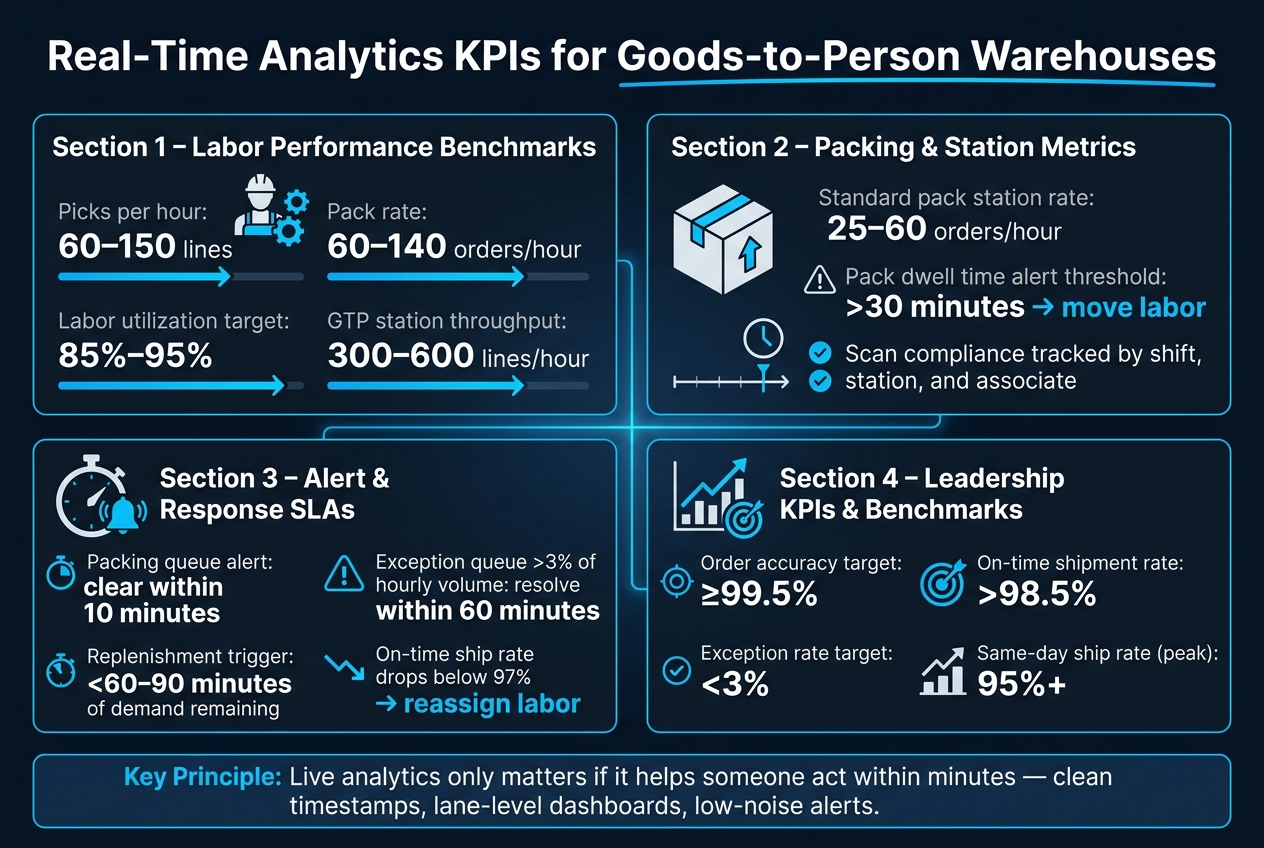
Labor signals show how well people are working. These include picks per labor hour, touches per associate, active time versus idle time, queue depth owned by each team, task acceptance rate, and indirect labor allocation. Role-based benchmarks help flag imbalance. Pick rates often run 60–150 lines per hour, pack rates 60–140 orders per hour, and utilization 85%–95%. When teams track these numbers by role and station, supervisors can rebalance work fast if one area starts slipping.
Machine signals show whether automation is keeping pace with demand. These include robot availability, tote delivery latency, robot-to-station handoff time, conveyor running state, jams, sensor faults, station uptime, and unplanned downtime.
The point is to read both sets of signals together. A team can only work as fast as automation delivers product. If tote latency climbs while associate active time stays steady, the bottleneck is probably automation or inventory flow. If active time drops and idle time rises while tote delivery looks normal, the problem is more likely task assignment or labor balance.
Together, these signals show whether the constraint sits with labor, automation, or inventory flow.
Signal quality and data alignment
Even a solid event model can fall apart if the incoming data is messy. The most common issues in live warehouse analytics are delayed scans, duplicate events, missing confirmations, mismatched timestamps across systems, and late-arriving automation messages.
The practical answer is a standard event format that every source system feeds into - WMS, WES, WCS, labor management, and automation platforms. Every record should include:
- a unique event ID
- an event timestamp
- an ingest timestamp
- a source system identifier
The event timestamp shows when the action actually happened. The ingest timestamp shows when the system logged it. The gap between the two helps spot late-arriving records before they distort live metrics.
JIT Transportation notes that integrated fulfillment platforms unify these systems, creating a single source of truth across operations.
Deduplication logic and reconciliation rules finish the model. Without them, the dashboard can drift away from the actual sequence of work, especially during peak periods when scans arrive out of order or confirmations show up late.
With clean inputs in place, the next layer is dashboards, alerts, and shift reporting.
How live metrics support picking, replenishment, packing, and exception lanes
Once event data is clean, live metrics can guide work lane by lane.
Picking and replenishment metrics that protect throughput
When labor and machine signals line up, live metrics make it easier to see where flow is slowing and where labor should move next.
The most useful metrics here are picks per hour, station queue depth, tote wait time, pick confirmation rate, short-pick frequency, replenishment request volume, replenishment response time, and stockout risk by SKU or zone. The key is to read them together. That’s how teams spot the bottleneck faster. GTP systems can reach 300–600 lines per hour per station, but that lift disappears fast when the pick face runs dry or queues grow faster than labor can clear them.
The readout is pretty straightforward: when queue depth and tote wait time rise, there’s an active bottleneck. Supervisors can react by opening another station, shifting labor from a lane with less pressure, or slowing upstream wave release so the system stays balanced.
On the replenishment side, replenishment response time often tells you which operations bounce back fast and which ones grind to a halt. Paired with stockout risk by SKU or zone, it helps managers focus on fast-moving SKUs and spot zones that keep draining. That matters even more during promotional spikes, when a local stockout can stall stations even though total inventory still looks fine.
Those signals shape packing priorities and exception routing.
Packing metrics that prevent delays at the end of the line
Packing is where pressure from earlier in the shift finally shows up. Picking may run well for hours, and then the whole day gets squeezed at the end if the pack area isn’t watched closely.
The metrics that best predict same-day shipping performance are pack rate, order dwell time before packing, cartonization exceptions, scan compliance, packing backlog, and orders completed by carrier cutoff. Standard pack stations handle 25–60 orders per hour per station. When dwell time and backlog start climbing before carrier cutoff, the recovery window gets tight.
Scan compliance needs close attention because teams often miss it until it starts causing trouble downstream. Low compliance usually points to process drift, rushed labor, or workarounds that help in the moment but lead to mis-shipments and inventory record errors later. Tracking scan compliance by shift, station, or associate makes it easier to see whether the issue is contained or starting to spread.
When backlog rises near cutoff, managers can add labor, simplify cartonization rules, or move cutoff-critical orders to the front of the line.
Orders that miss the pack lane shift into exception handling, where aging and rework become the main focus.
Exception lane metrics that keep rework under control
Exception lanes are where small issues turn expensive if no one stays on top of them. Exception volume, exception type, aging by hold reason, rework cycle time, unresolved inventory discrepancies, damaged unit handling, and orders at risk of missing SLA define the control surface here.
Exception volume and type show how much work is getting pushed out of normal flow and why. Aging by hold reason is the metric that stops exceptions from quietly eating up labor in the background. The longer a hold stays open, the more likely it is to push an order past an SLA threshold. A dashboard that shows hold duration by root cause helps managers escalate the right exceptions before they turn into missed commitments.
Rework cycle time shows how long exceptions stay off the line. If one exception type keeps taking longer to fix than the others, that’s a clear signal to assign trained labor to it or fix the upstream process that keeps creating it. Fast exception clearing keeps more labor free for picking and packing.
These lane-level metrics feed the dashboards, alerts, and shift reports covered next.
Dashboards, alerts, and reporting views for warehouse teams
Operational dashboards for floor management
Once live signals are in place, the next step is putting them in front of floor teams in a format they can use on the spot. The screen should follow the same path as the work on the floor: picking at the top, replenishment under that, packing next, and exceptions off to the side. Each supervisor should only see the metrics they can act on right now: current order backlog, pick queue depth, replenishment aging, packing lane backlog, shipment cutoff risk, open exceptions by age bucket, and labor productivity.
Color bands make this much easier to use. A simple three-part setup - green for normal, yellow for early risk, red for action needed - helps a shift lead glance at the screen while moving through the warehouse and spot trouble fast. Zone leads should see their own area, plus the upstream and downstream lanes that affect it. A full-system view sounds nice, but in practice it can bury the signals that matter most.
Station-level utilization tiles are especially helpful in goods-to-person operations. Heat maps or utilization gauges can show, at a glance, whether pods or packing stations are sitting idle or getting overloaded. That gives supervisors a chance to move labor before queues start stacking up.
Alerts and escalation rules
Dashboards show what's happening. Alerts tell people when to step in. In a goods-to-person setup, every alert should have a clear owner, a set response window, and a written playbook for what happens next.
Queue growth alerts should fire based on both absolute thresholds and rate of change. For instance, a pack backlog alert might trigger when backlog crosses the carrier-cutoff threshold, giving the outbound lead enough time to add packers or change batch priority. Idle-station alerts should trigger when a station with assigned work shows zero activity for more than 3–5 minutes. Low-inventory alerts should connect to forecasted demand instead of static minimums.
Alert fatigue is a real risk on the floor. The fix is pretty simple: if an alert doesn't lead to a clear action, it shouldn't send a push notification. Routine swings that teams can recover from without stepping in should stay visible on the dashboard, but they shouldn't make noise. Grouping related alerts helps too. Instead of sending three separate pings for three idle stations, send one "zone health" notification. That cuts clutter without muting urgency. Quarterly reviews of alert logs help teams spot which rules get ignored and which thresholds need to be reset as volume and workflows shift.
Shift summaries and historical reporting
When the shift ends, the same data should roll up into summaries that are easy to review. End-of-shift reporting should include total throughput by hour, average and peak backlog at each workflow, labor utilization rates, exception counts by category, and a plain variance line - for example, "planned 15,000 units, actual 17,500 (+16.7%)" - so supervisors can tie live interventions back to final results. These reports should use local timestamps, such as "Shift: 7:00 a.m.–3:00 p.m.", and be simple to review during handoff.
Weekly reviews should go a level deeper. They should pull variance data across several days, show recurring exception categories in rank order, and track carrier-cutoff adherence by lane and service level. When transportation sets the actual cutoff, JIT Transportation can feed carrier performance data back into warehouse reporting. That helps teams tune cutoff thresholds around actual transportation limits instead of internal assumptions alone.
How to run a real-time analytics layer in a high-growth DTC environment
Decision rules for labor balancing and recovery
Once dashboards and alerts are live, the next job is simple in theory and hard in practice: turn those signals into fixed labor moves. The best way to do that is with prewritten triggers so supervisors can make a call in minutes, not stand around debating it.
Using queue depth, dwell time, replenishment risk, and exception aging, three triggers handle most recovery situations:
- Move pickers to packing when pack dwell time goes above 30 minutes per station
- Reassign noncritical labor to outbound work when projected on-time shipment rate drops below 97%
- Trigger urgent replenishment when a bin has less than 60 to 90 minutes of demand left, especially for fast-moving promo SKUs
Timing matters just as much as the rule itself. A packing queue alert should be cleared within 10 minutes. If exception queues move above 3% of hourly order volume, teams should bring them back under control within 60 minutes. DTC operations that maintain a 95%+ same-day ship rate treat these response SLAs as non-negotiable during peak periods.
What leadership should measure beyond the live dashboard
Floor metrics protect the shift. Leadership metrics protect the business.
Leaders need KPIs tied directly to margin and service, not just a live view of what's happening on the floor. That means tracking order cycle time from placement to shipment confirmation, cost per order in USD, labor cost per unit, exception rate, inventory accuracy, on-time shipment rate, and peak throughput in units per hour.
These numbers show whether labor, automation, and inventory signals are still lining up as volume grows. Benchmarks help put those KPIs in context. A competitive DTC operation aims for ≥99.5% order accuracy, on-time shipment rates above 98.5% for top providers, and an exception rate below 3%.
A weekly review cadence helps leadership spot structural problems early enough to do something about them.
For brands scaling through promotions and seasonal peaks, JIT Transportation can support a real-time analytics layer with integrated data across transportation, distribution, and fulfillment. Its value-added fulfillment services can feed standardized events into one reporting view, which helps brands track fulfillment cost per order alongside transportation cost per order and shift volume when one site reaches capacity.
Conclusion: Core requirements for effective goods-to-person analytics
At scale, this only works when floor actions and leadership KPIs run off the same data. Effective real-time analytics in a goods-to-person operation depends on clean, aligned signals from labor and machine sources, workflow-specific metrics across picking, replenishment, packing, and exception lanes, and dashboards built for fast intervention.
There’s also a human side to it. Teams have to trust the data, or the dashboard becomes wallpaper. When analytics leads to action within minutes of a threshold breach, teams protect throughput, hold accuracy targets, and keep shipping commitments intact even during the toughest peaks.
FAQs
What data is needed for real-time GTP analytics?
Real-time goods-to-person (GTP) analytics depend on one thing: a steady, connected stream of data across picking, replenishment, packing, and exception handling.
The main inputs include live inventory and SKU data, order status, and movement data from barcode scans, RFID, and IoT sensors. Teams also need labor metrics, machine signals, sales data, demand forecasts, and supplier lead times. When all of that sits in the WMS, teams get the visibility they need to improve workflows.
How do live alerts improve labor decisions?
Live alerts help supervisors shift from reacting after the fact to making decisions in the moment. When a system spots a drop in performance - like slower picking or a zone starting to lag - it sends an instant notification so managers can move people where they’re needed right away.
With a clear view of pick rates and task completion times, these alerts make it easier to reassign work fast and coach specific team members where needed. That helps keep labor pointed at the highest-priority areas instead of letting small slowdowns turn into bigger problems.
Which KPIs matter most for same-day shipping?
For same-day shipping, keep your eye on the KPIs that show speed and accuracy:
- On-Time Shipping Rate
- Order Fulfillment Speed
- Pick Accuracy
- Inventory Accuracy
It also helps to set a clear order cutoff time. In most cases, that falls between 12:00 PM and 3:00 PM. That way, customers know the window, and your team knows what has to move NOW.
Strong operations often target inventory accuracy above 99.5%. They also keep inventory synced in real time every 5 minutes or less. If stock data lags, same-day shipping can fall apart fast. A product may look available online, but the shelf tells a different story.
Related Blog Posts
Related Articles
3PL Warehouse Automation: Guide for Fast Growth

How 3PL Partners Share Supply Chain Risk