
Cross-Border Demand Forecasting: Guide For 3PL Teams

If your cross-border forecast is off, the cost shows up fast: missed SLAs, stockouts, idle labor, and extra freight spend. From my read, the fix is simple in concept: I need to plan by SKU + country, track lead-time variation instead of averages, and tie the forecast to warehouse labor, inventory, and inbound schedules.
Here’s the article in plain English:
- Cross-border forecasting is not just a planning task. I have to treat it as a day-to-day warehouse and inbound planning job.
- Country demand cannot be blended. Each market has its own holidays, promos, buying patterns, customs rules, and transit delays.
- Forecast ownership is shared. The brand brings the demand signal; the 3PL turns that signal into staffing, space, dock, and inbound plans.
- Data has to match across systems. ERP, WMS, commerce, TMS, ASNs, item data, units of measure, and customs data all need to line up.
- Forecast detail matters. A common starting point is SKU-country, with SKU-warehouse or SKU-channel used when the decision calls for it.
- Use item segmentation. ABC/XYZ helps me decide which SKUs need tighter reviews and which need bigger buffers.
- Measure the right numbers. The article points to WMAPE, bias, FVA, OTIF, ASN accuracy, transit-time variance, and inventory turns.
- Run a fixed review rhythm. The article recommends a 4-week rolling forecast, a 1-week hard lock, and a review if variance goes above 20% week over week.
- Inventory rules should reflect lane risk. Safety stock and reorder points should use the full lead-time range, not one average.
- Inbound plans need buffer for clearance risk. Tight dock appointments of 15 to 30 minutes and pallet-level ASNs help receiving stay on track.
A quick way I’d frame the whole piece: clean data in, lane-aware forecast out, then turn that forecast into labor, stock, and shipment moves before delays hit.
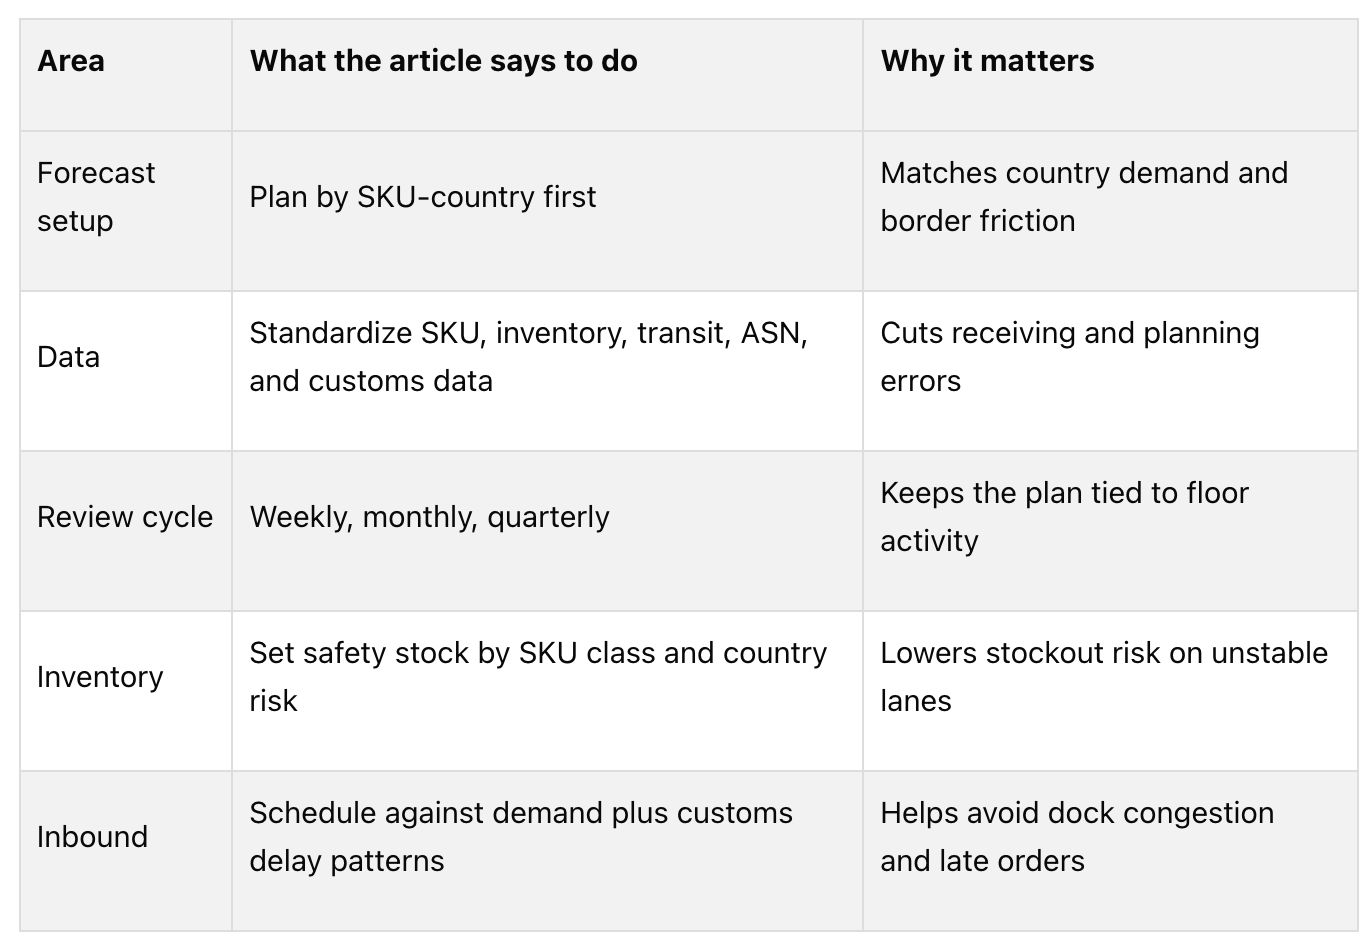 If I had to boil it down to one line: cross-border forecasting works best when I treat lead time, customs, and local demand as part of the forecast itself - not as side issues.
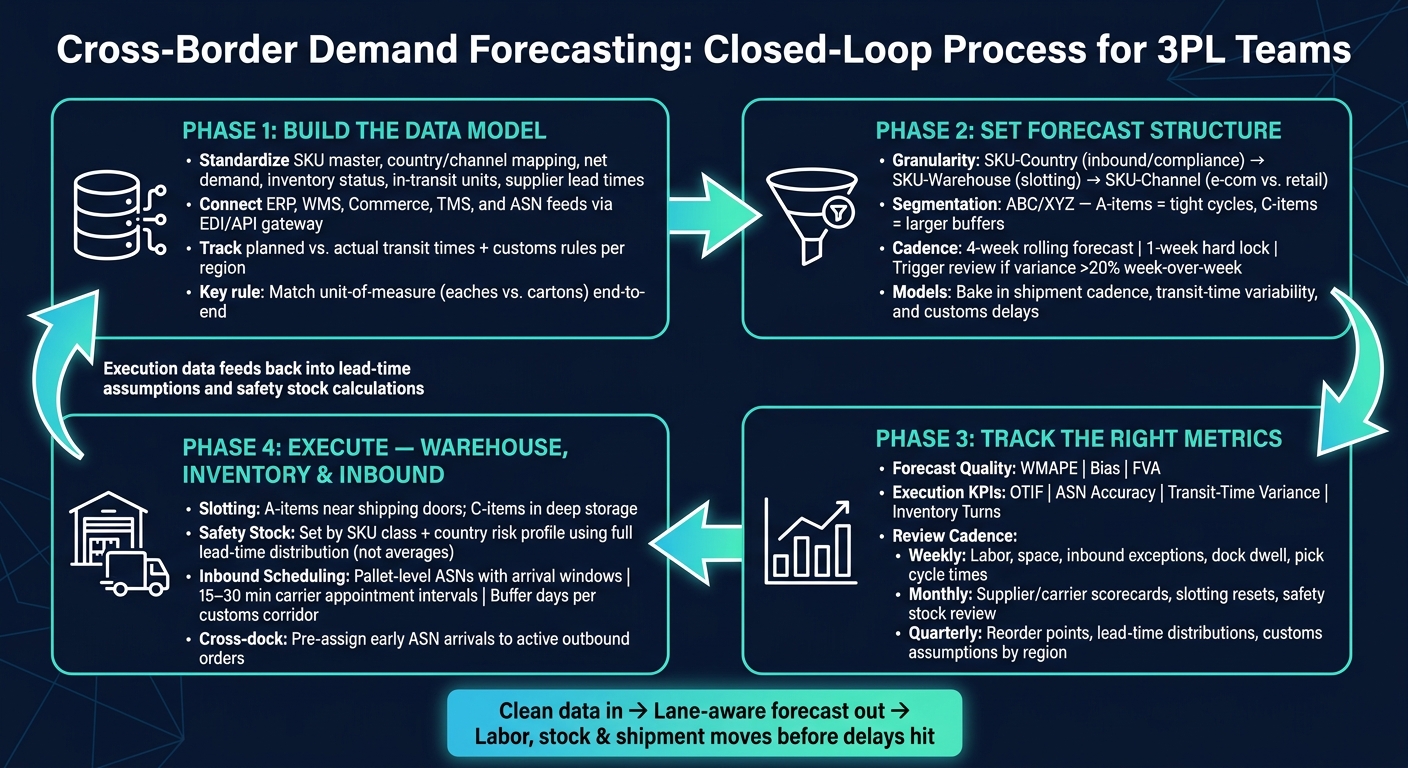
Cross-Border Demand Forecasting: Closed-Loop Process for 3PL Teams
Build the Forecasting Data Model and System Flow
Once ownership is clear, the next move is a shared data model that turns demand signals into a plan your team can actually use.
Standardize Demand, Inventory, and Lead-Time Data Across Countries
Before you run a single forecast, build one shared data model across every country, SKU, and system. At a minimum, that model should include a clean SKU master, country and channel mapping, net demand after cancellations and returns, inventory status by location, in-transit units, and supplier lead times. It should also flag promotions, new product introductions, and seasonality early, so inbound plans can shift before demand does. For cross-border lanes, track planned-versus-actual transit times, shipment cadence, and customs documentation rules for each region.
Item dimensions, weights, hazardous flags, and barcode/RFID mappings also need to match across ERP, WMS, and the commerce platform. If a SKU is sold in eaches but shipped in cartons, that conversion has to be checked from end to end. When unit-of-measure data doesn’t line up, receiving slows down and inventory errors stack up fast in a multi-country setup.
Lead-time data needs the same level of care. Measure supplier-to-dock, dock-to-putaway, and pick-to-ship lead times. And don’t stop at the average. Track variability for each leg, because variability is what drives safety stock.
"JIT feeds on timely, trustworthy data. Garbage in, rush fees out." - Ashley Taylor, Product Manager, Cleverence
After the data model is in place, the next job is connecting the systems that keep it fed in real time.
Connect Commerce, WMS, ERP, and Transportation Feeds
Create one planning layer that pulls in orders, promotions, returns, receipts, shipments, and carrier events. In practice, an EDI/API gateway is usually the cleanest way to do this. It links commerce order drops, WMS fulfillment data, and TMS carrier milestones without manual re-entry.
Advance Ship Notices (ASNs) matter a lot here. They should include pallet- and carton-level detail, plus SSCC labels, so the system can pre-assign inbound stock to open outbound orders before the freight even arrives. If ASNs show up late or missing details, the inbound plan starts to fall apart.
For cross-border lanes, customs and ERP feeds should also show tariff changes, duty structures, country-specific documentation rules, and clearance delays that affect lead-time accuracy. That ties straight back to the border delays and paperwork issues that throw off forecast reliability.
It also helps to set a variance threshold that triggers a 3PL-client review. That gives teams a way to catch promotions, supplier limits, or data issues before they spill into warehouse and labor planning.
Choose Forecast Granularity Before Building Your Model
Pick granularity based on the decisions the forecast needs to support. SKU-country is a strong starting point for inbound scheduling and compliance planning because it reflects transit-time swings and border crossings by market. SKU-warehouse fits slotting and replenishment better, where bin sizing and travel distance matter more than border movement. SKU-channel helps separate e-commerce and retail demand when order rhythms and cutoff times differ.
A simple rule works well here: use ABC/XYZ segmentation to decide how tight the forecast should be. High-velocity, low-variability A-items can handle tighter forecast cycles and finer granularity. Slow-moving, high-variability C-items need larger buffers and usually gain little from daily-level detail. A 4-week rolling forecast with a 1-week lock period helps steady inbound and labor plans.
That structure becomes the baseline for model selection, accuracy tracking, and review cadence.
sbb-itb-eafa320
Set Up Forecasting Models, Metrics, and Review Cadence
Once your data is clean and your level of detail is set, the next move is simple: pick a forecasting method that fits the job, watch the signals that matter, and build a review rhythm that keeps the numbers honest.
Select Models That Fit SKU Volatility and Market Complexity
Use item segmentation to decide how deep the model needs to go. Then match the model to promotion sensitivity, seasonality, and lane volatility.
For cross-border demand, bake in shipment cadence, transit-time variability, and customs delays. If you don’t, the forecast may look fine on paper but miss the lead-time swings that hit day-to-day planning. When manual planning can’t keep up with multi-client flows, peak periods, or lead-time shifts, forecasting and DRP automation start to make sense.
Reorder points should come from lead-time variability, not one average number. That way, country-level delays and clearance risk are part of the plan from the start. This choice also shapes how often you review the forecast and how closely you handle exceptions.
Track Accuracy With the Right Operating Signals
Start with forecast quality. Then check whether operations back it up.
Use WMAPE, bias, and FVA to judge forecast quality. After that, connect those numbers to execution KPIs like OTIF, ASN accuracy, transit-time variance, and inventory turns. That’s how you see whether the forecast is turning into steady execution, not just neat math.
Trigger a review when week-over-week variance goes above 20% to find causes such as promotions or supplier constraints. The point of that review is to find root causes and signal problems early, not point fingers.
Run a Weekly, Monthly, and Quarterly Review Cycle
A three-tier cadence keeps forecasting tied to execution without burying the team in meetings.
Weekly reviews should turn forecast shifts into labor, space, and inbound decisions. Keep the focus on near-term exceptions: inbound adherence, dock dwell time, pick cycle times, and any variance that crossed the review threshold. This is where fast calls matter most - move labor, flag a delayed shipment, or escalate a customs hold before it disrupts picking.
Monthly reviews are better for resetting partner performance and inventory assumptions. Review supplier and carrier scorecards with ASN accuracy and on-time arrival at the center. It’s also a good time to revisit slotting for high-velocity SKUs ahead of a demand peak and check whether safety stock still matches actual lead-time variability.
Quarterly reviews should reset model parameters. Re-examine reorder points, lead-time distributions, and service-level targets against actual performance. For cross-border lanes, use this review to update customs assumptions by region and adjust for any documentation or border-crossing bottlenecks that affected transit times during the quarter.
Turn Forecasts Into Warehouse, Inventory, and Inbound Plans
Once the forecast is set, the next job is simple: put it to work. A forecast only has value when it changes where stock sits, how many people are on the floor, and when inbound freight shows up.
Plan Warehouse Capacity, Slotting, and Labor From Country-Level Demand
Start with ABC/XYZ segmentation. High-velocity A-items should sit close to shipping doors with easy, ergonomic access. Slow-moving C-items can go deeper into storage, where extra travel time has less impact. That keeps picker travel down and protects forward-pick space for the items that move fast.
Slotting should also change when the country-level forecast changes the order mix. If demand is expected to jump in one country for a certain SKU class, move those products forward before volume lands. If you wait until pick cycle times start creeping up, you're already behind.
Labor planning follows the same logic. Tie staffing to the forecast lock window. If inbound shipments slip because of cross-border delays, shift that labor to other work right away instead of letting a dock crew stand around. And if you have value-added services, plan those labor hours on their own rather than burying them in a general staffing number.
Put another way: labor takes the hit first, inventory backs it up.
Set Inventory Targets and Safety Stock for Multi-Country Fulfillment
A single safety stock rule won't work across every SKU and every country. Set safety stock by SKU class and by country risk profile. A-items in markets with short lead times and high service-level promises need tighter, numbers-based buffers. C-items in steadier lanes can run with lower service levels to cut holding costs.
When you calculate reorder points, use the full lead-time distribution for each lane, not just the average. That matters because a two-day customs swing in one corridor can throw off inventory far more than a neat average would suggest.
Service-level targets should shift by channel too. In one market, e-commerce orders may need daily reorder reviews, while retail replenishment in that same country can be reviewed weekly. Margin sensitivity and shelf-life matter as well. A high-margin product with a short shelf life moving through a cross-border lane needs a very different inventory policy than a durable, low-margin SKU.
"Predictive inventory models combined with real-time data eliminate that tradeoff [between excess inventory or missed demand] by turning inventory planning into a strategic advantage." - JIT Transportation
From there, inbound plans need to line up with those inventory targets.
Schedule Inbound Shipments Against Forecasted Demand and Clearance Risk
Inbound scheduling is where bad forecasts stop being abstract and start costing money. PO timing, container planning, and truckload planning should match forecasted demand, with enough buffer for customs delays but not so much that stock piles up.
Pallet-level ASNs with estimated arrival windows make it possible to build a receiving plan around actual inbound flow instead of guesswork. If an ASN shows an early arrival, you can pre-assign that inventory to active outbound orders and send it through cross-dock instead of through full putaway. If a shipment is late, you see it soon enough to shift labor and move other inbound loads up the line.
For cross-border lanes, map known customs bottlenecks by lane and add buffer days to the inbound schedule based on past customs and transit delay data for each corridor. Carrier appointment windows should stay tight. 15–30 minute intervals help cut dock congestion and give you clean timestamps for planned-versus-actual transit comparisons.
Conclusion: Build a Closed-Loop Cross-Border Forecasting Process
Once the data model, cadence, and inventory rules are in place, the work shifts to closing the loop. Cross-border forecasting runs as a single loop: data updates the model, the model shapes the plan, and execution feeds the next cycle. When you send performance data back into lead-time assumptions and safety stock calculations, the forecast gets better with each round.
Key Steps 3PL Teams Should Act on First
From here, focus on the few moves that change day-to-day execution.
Start with standardized demand inputs. Then set forecast granularity, hard lock windows, and a variance trigger. Use a 4-week rolling forecast with a 1-week hard lock-in. If week-over-week variance reaches 20%, trigger a structured client review. Then close the loop with weekly floor reviews and KPI checks. Use each cycle to reset assumptions before the next shipment window opens.
FAQs
What data should we clean first?
Start by cleaning up historical shipment data and inventory records. The first step is to sync data across your ERP, WMS, and CRM systems so the numbers line up and each record tells the same story.
Next, look at past order volume by lane, transit times, and bottlenecks that kept showing up. Then use automated reconciliation to flag gaps, like inventory counts that don’t match, and send those issues for manual review before you bring in outside variables.
How do we forecast new SKUs?
Forecasting new SKUs starts with clean master data. That means standard descriptions, pack sizes, and other core product details need to be in order so you can build a baseline you can trust.
When there’s no sales history to lean on, get aligned with brand partners early. Talk through promotional calendars, product launches, and seasonal timing before inventory lands. If that step gets skipped, the forecast can drift fast.
Use those inputs to put together an initial inbound plan. This gives the 3PL time to adjust capacity and slotting before stock arrives, instead of scrambling at the last minute.
After that, review performance every week or every other week. As sales data starts coming in, update replenishment thresholds and safety stock so the plan reflects what’s happening on the ground.
When should we change safety stock by country?
Adjust safety stock by country when the data shows agreed variance thresholds have been crossed, such as a 20% week-over-week deviation. You should also update it when demand starts to shift with the season, especially during peak shopping periods, by using 6- to 12-week historical SKU uplift patterns.
It also makes sense to review stock levels when lead-time variability changes. The same goes for disruptions, geopolitical risk, or trade rules that affect certain regions. AI-driven dynamic management can help fine-tune these levels on a steady basis using actual demand data.
Related Blog Posts
Related Articles
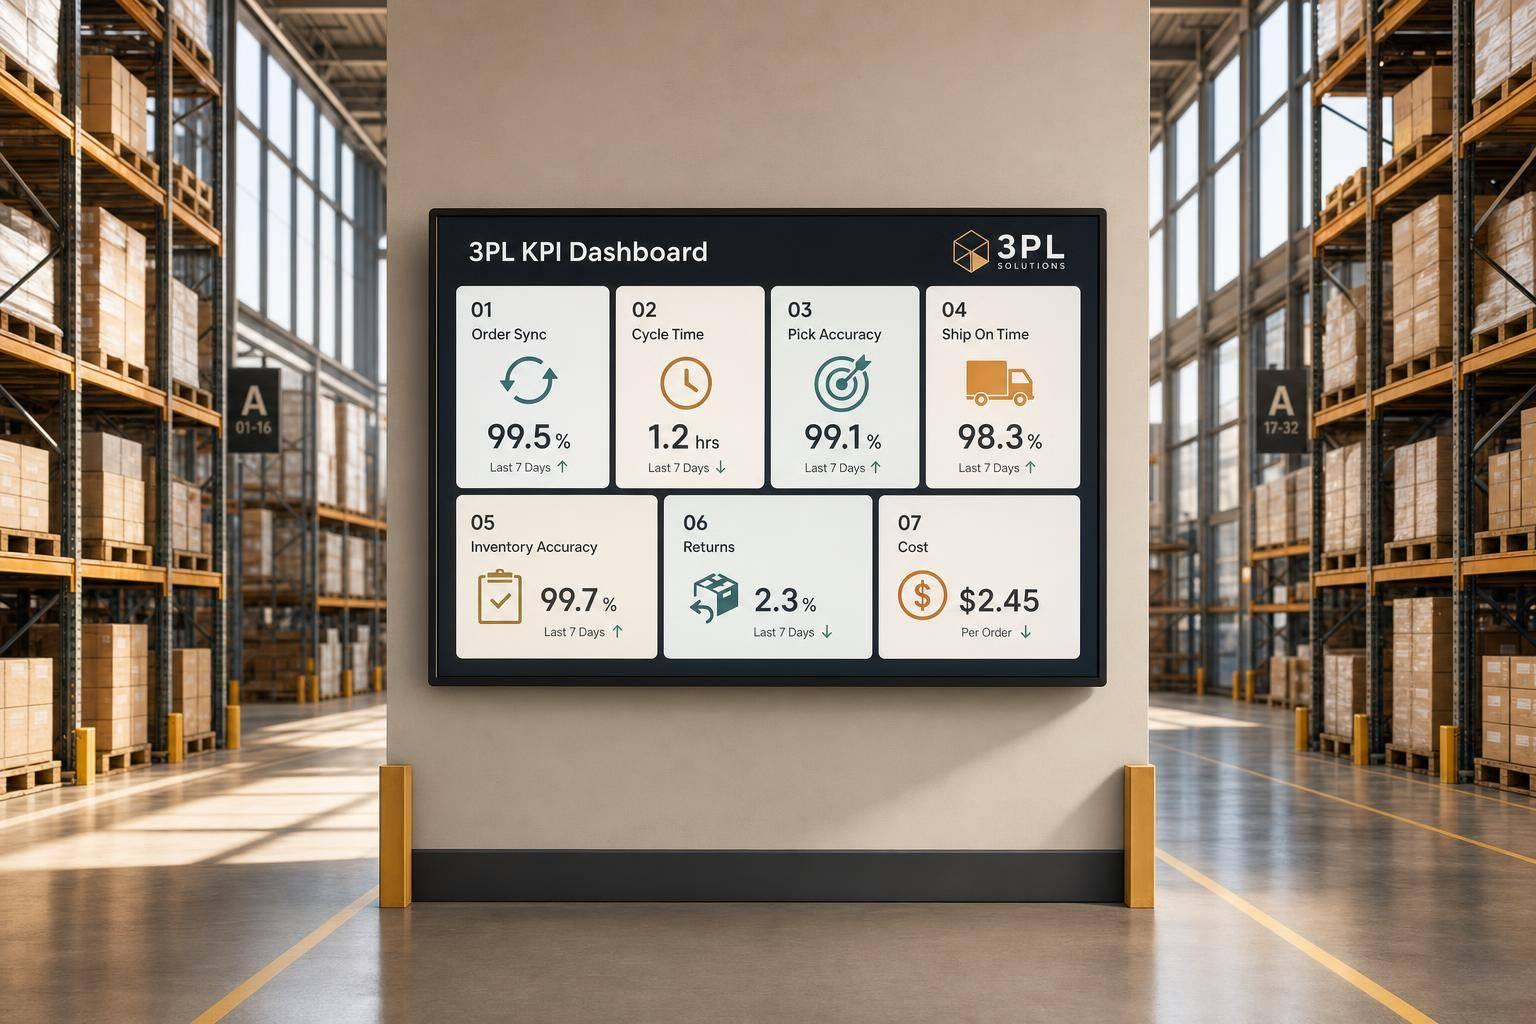
7 WooCommerce 3PL KPIs Teams Track

Centralized vs Decentralized Replenishment
