
Forecasting Storage, Pick, Pack, and Returns Fees
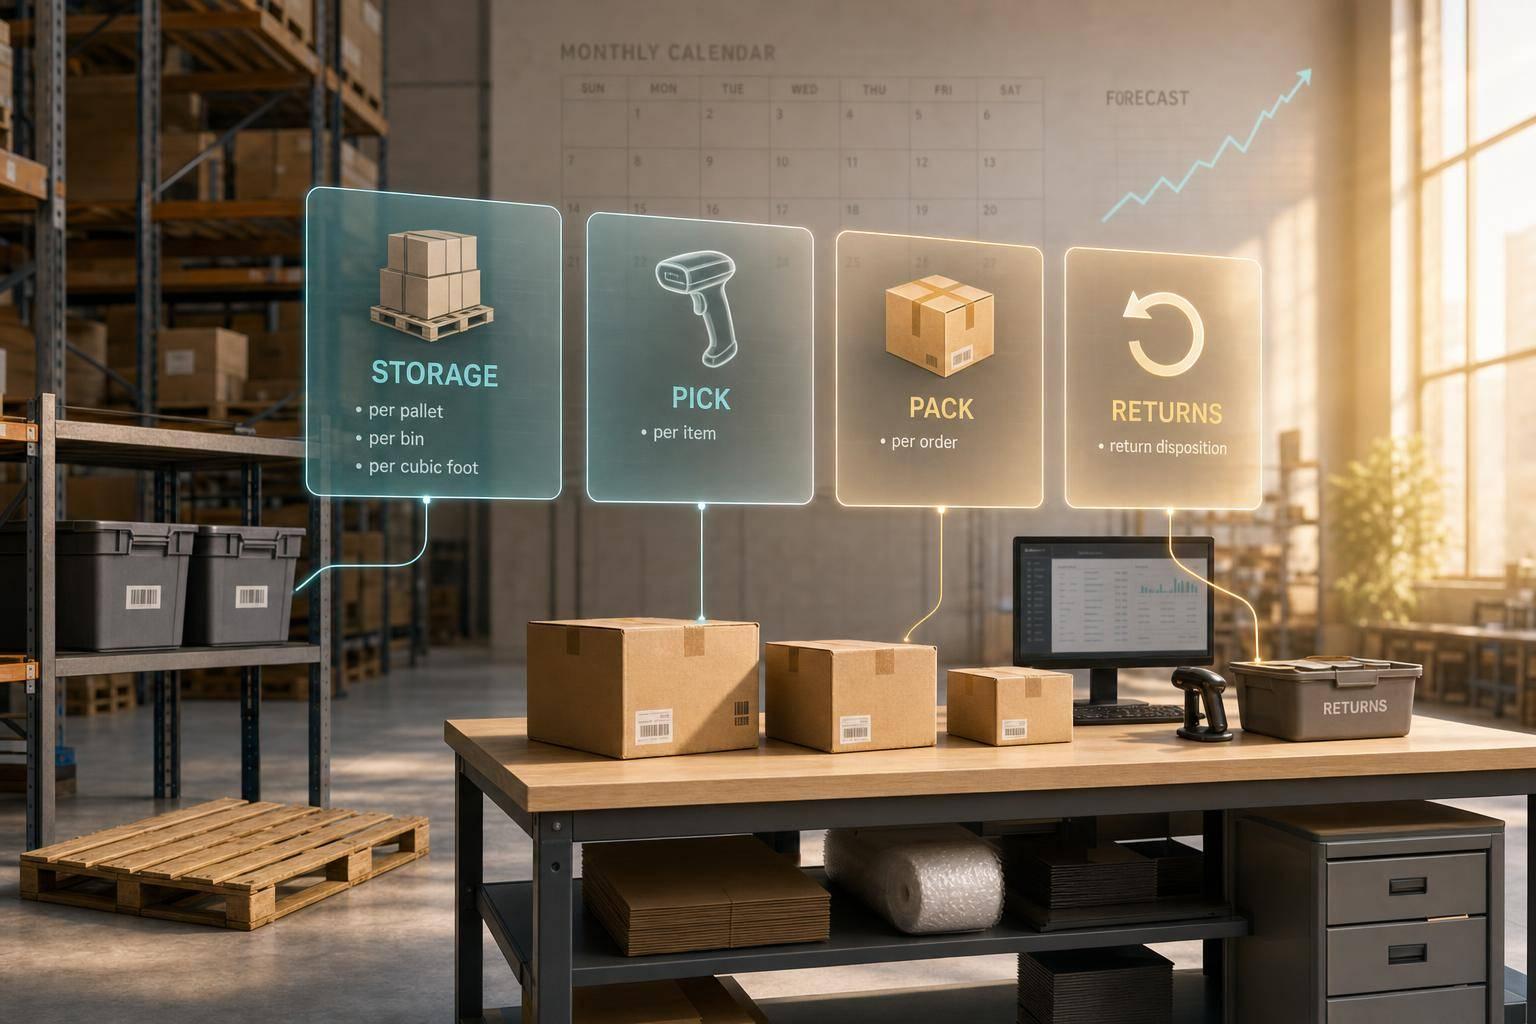
If I want a usable warehouse fee forecast, I need four numbers modeled every month: storage, pick, pack, and returns. That’s the core idea. Storage is tied to space on hand, pick and pack move with orders and units, and returns can add $3.00 to $12.00 per unit before label cost.
Here’s the short version: I start with orders, units per order, pallets or bins on hand, SKU count, and return rate. Then I price storage by pallet, bin, or cubic foot; price pick and pack by order and item count; and split returns by what happens next - restock, refurbish, liquidate, or dispose. I also need to watch for peak swings, since holiday volume can jump 200% to 400% and surcharges can add 10% to 30%.
If I had to boil the whole article down, it would be this:
- Storage = average space used × monthly rate
- Pick fees = items picked × per-item rate
- Pack fees = orders shipped × per-order rate
- Returns = returned units × handling steps and label costs
- True cost per order = all monthly fulfillment costs ÷ total orders
A few numbers shape the model fast:
- Pallet storage often runs $18.00 to $25.00 per pallet per month
- Bin storage often runs $1.00 to $5.00 per bin per month
- Cubic-foot storage often runs $0.35 to $0.85 per cubic foot per month
- Pack fees often run $1.50 to $4.00 per order
- Pick fees often run $0.30 to $1.50 per item
- Returns processing can land at $360.00 to $1,440.00 for 120 returns
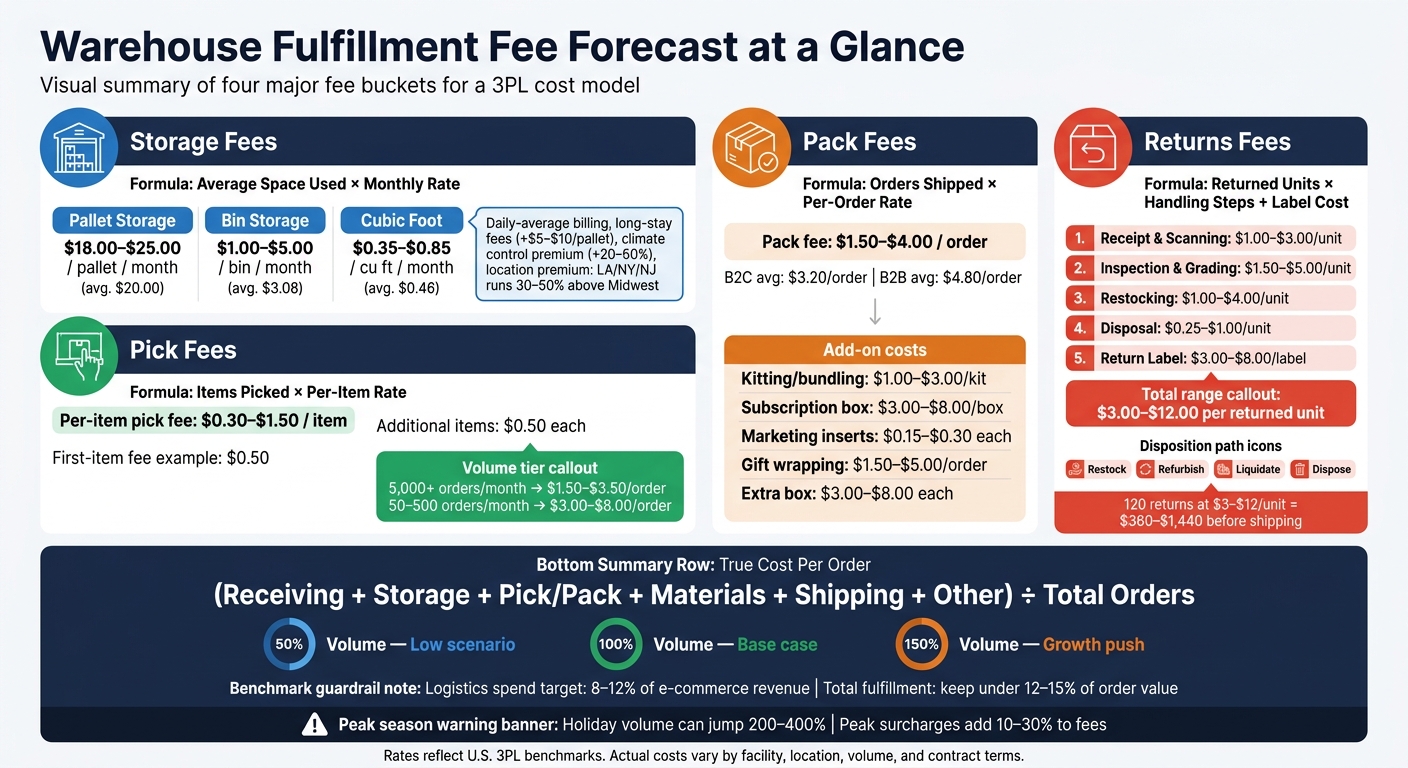
Warehouse Fee Forecast: Storage, Pick, Pack & Returns Cost Breakdown
How 3PLs calculate your storage fees
sbb-itb-eafa320
Quick Comparison
| Fee bucket | Main driver | Common pricing basis | Watch-outs |
|---|---|---|---|
| Storage | Inventory on hand | Per pallet, per bin, or per cubic foot | Daily average billing, long-stay fees, climate control, location |
| Pick | Units in each order | Per item | Higher units per order push cost up |
| Pack | Number of orders | Per order | Extra boxes, inserts, gift wrap, channel mix |
| Returns | Return rate and condition | Per returned unit and per handling step | Label cost, inspection, restocking, disposal, hourly exception work |
My takeaway: don’t use one blended average if the work is different. I get a better monthly forecast when I split costs by billing unit, by channel, and by return outcome - then test the model at 50%, 100%, and 150% of expected volume.
How to Forecast Storage Fees by Pallet, Bin, and Space Used
Per-Pallet and Per-Bin Formulas
Start with the billing unit your 3PL uses: pallet, bin, or cubic foot. That choice sets the whole calculation.
For pallet storage, multiply your average pallets on hand by the monthly rate per pallet. For bin storage, multiply your active bin count by the monthly bin rate.
Here’s what that looks like in plain math:
- 40 pallets × $20.00 per pallet per month = $800.00/month
- 200 bins × $3.00 per bin per month = $600.00/month
So if you use both, you’d stack those charges together.
Pallet storage usually runs $18.00–$25.00 per pallet per month, with a national average of about $20.00. Bin storage averages $3.08 per bin per month, with a range of $1.00–$5.00. Those rates shift based on product mix, location, and facility type.
One detail can change the math fast: how the 3PL bills storage. Some use an end-of-month snapshot. Others bill on a daily average. That daily-average method can cost more during months when inventory builds up, so make sure you know which one applies before you lock in your forecast.
When to Add Cubic Foot, Dwell Time, and Storage Adjustments
Standard pallet or bin pricing doesn’t always fit the way inventory sits in a warehouse. If your stock profile is uneven, add a few extra layers to the estimate.
If you carry inventory with widely varying sizes and weights, cubic-foot pricing is often a better fit. The national average is $0.46 per cubic foot per month, with a range of $0.35–$0.85. To estimate the monthly charge, multiply your total inventory cubic volume by that rate.
Slow-moving SKUs need extra attention too. Many warehouses add long-term storage penalties when inventory stays past 90 to 180 days. Those surcharges usually add $5.00–$10.00 extra per pallet per month for inventory expected to sit that long.
For temperature-sensitive goods, plan for a 20%–50% premium. Climate-controlled pallet storage usually lands at $22.00–$30.00 per pallet per month.
Location matters. Warehouses in Los Angeles or the New York/New Jersey corridor often run 30%–50% above similar facilities in the Midwest or Southeast. If speed isn’t a constraint, inland storage can cut cost in a meaningful way.
Once storage is modeled, forecast pick and pack from your order mix.
How to Forecast Pick and Pack Fees From Your Order Profile
Pick and pack fees move with order count, units per order, and how much handling each shipment needs. If your orders look simple on the surface, it’s easy to miss where cost starts to stack up.
Formulas for Per-Order, First-Item, and Additional-Item Pricing
Most 3PLs split pick and pack into two parts: a flat pack fee per order and a per-item pick fee. The pack fee covers the work of putting the shipment together and sealing the box. That part usually stays the same no matter how many items are in the order. The pick fee is added for each unit picked.
The core formula looks like this:
Monthly pick and pack cost = (Total orders × first-item fee) + (Additional items × additional-item fee) + (Total orders × pack fee)
Here’s a simple example:
1,000 orders × $2.00 pack fee + 1,000 first-item picks × $0.50 + 1,000 additional items × $0.50 = $3,000.00/month
U.S. benchmark ranges put the pack fee at $1.50–$4.00 per order and the per-item pick fee at $0.30–$1.50 per item. The industry-wide average for B2C pick and pack is about $3.20 per order.
Volume also changes the math. Brands shipping 5,000+ orders per month often get per-order rates in the $1.50–$3.50 range. Lower-volume shippers doing 50–500 orders per month can pay $3.00–$8.00 per order. That’s why units per order matter so much. When average items per shipment go up, cost can climb a lot faster than order count alone would suggest.
How Packaging, Kitting, and Order Complexity Affect Cost
Standard pick and pack pricing assumes a pretty basic flow: pick the item, place it in a mailer or box, seal it, and apply the label. Once that flow changes, cost goes up. Simple as that.
Kitting, assembly, inserts, and gift wrap should be forecast as separate charges. Straightforward kitting and bundling runs $1.00–$3.00 per kit, or $35.00–$60.00 per hour for labor-heavy assembly. Subscription box builds with multiple SKUs usually run $3.00–$8.00 per box.
Other add-ons stack on top:
- Marketing inserts: $0.15–$0.30 per insert
- Gift wrapping: $1.50–$5.00 per order
- Each extra box: $3.00–$8.00 added to the cost
The safest way to forecast this is to price each service on its own instead of folding everything into one average. Then split those charges by channel. DTC, wholesale, and subscription orders rarely follow the same handling path, so treating them as if they do can throw off your numbers.
Forecast by Channel Instead of One Blended Average
After you price the base workflow, break the forecast out by channel. A blended pick and pack rate can look neat in a spreadsheet, but it often hides what’s driving spend.
DTC, wholesale, and subscription orders can have very different pick, pack, and packaging costs. B2B fulfillment averages $4.80 per order, compared with $3.20 for B2C. That gap is big enough to change how you read your margins.
Build separate assumptions for each channel, including:
- Orders per month
- Average units per order
- Packaging type
- Any value-added service needs
Run the formula for each channel on its own. When you add the totals back together, you’ll see where fulfillment spend is concentrated and which part of the business costs the most to serve.
How to Forecast Returns Fees by Condition and Handling Step
After outbound fulfillment, returns are often the last big variable cost. And they’re easy to underestimate.
The key point: returns are not one fee. You need to model each step on its own: receipt, inspection, grading, and disposition. A single returned item can trigger several charges, including receiving, inspection, grading, restocking, and disposal.
The Basic Returns Formula and Typical Cost Layers
A simple starting point looks like this:
Monthly returns cost = returned units × per-unit handling fee
Here’s the math in plain English: if you have 1,000 orders and a 12% return rate, that creates 120 returns. At $3.00–$12.00 per unit, processing alone lands at $360–$1,440 before shipping and labor.
Typical cost layers include:
- Receipt and scanning: $1.00–$3.00 per unit
- Inspection and grading: $1.50–$5.00
- Restocking: $1.00–$4.00
- Disposal for unsellable items: $0.25–$1.00 per unit
That’s why a return that looks small on the surface can get expensive fast.
Condition-Based Forecasting: Restock, Refurbish, Liquidate, or Dispose
Not every return takes the same path. Some go straight back on the shelf. Others need extra work. Some are dead on arrival from a resale standpoint.
Because of that, it helps to split return volume by SKU or product category when condition and handling are different. Then assign a separate cost assumption to each disposition bucket.
Undamaged, resalable items can usually be restocked after receipt, inspection, and grading. Lightly damaged or opened items may need to move into open-box or refurbished inventory, which adds repackaging or relabeling work. Items that can’t be resold at any grade usually go to liquidation, recycling, or disposal.
For standard relabeling, budget $0.10–$0.25 per unit. Exception work is often billed hourly instead of by unit, usually at $30–$60 per hour.
Policy Inputs That Affect the Returns Model
Your return policy has a direct effect on both return volume and how much work each return creates. So it should be treated as an input in the model, not an afterthought.
Start with label ownership. If your 3PL generates the return label, budget $3.00–$8.00 per label as its own line item. Also add a buffer for exception handling, since that work is often billed hourly instead of per unit.
If you’re using JIT Transportation for returns management and RMA workflows, define restock, grade, and destroy rules upfront. That makes per-unit costs easier to forecast and helps avoid messy edge cases later.
Use these return assumptions as the last input before rolling all fulfillment fees into one monthly model.
Build a Monthly Fulfillment Fee Model and Use It for Decisions
Combine the Formulas Into One Monthly Cost View
Once you’ve mapped each fee bucket, pull them into one monthly view. Then add any other recurring charges and divide by total orders to get your true cost per order. That number helps with pricing, budgeting, and channel comparisons.
True Cost Per Order = (Receiving + Storage + Pick/Pack + Materials + Shipping + Other monthly charges) ÷ Total Orders
Yearly averages can smooth over what happens during peak months. That’s a problem. December volume can jump 200% to 400% above baseline, and peak-season surcharges of 10% to 30% on fulfillment fees are common. A better move is to pressure-test the model at 50%, 100%, and 150% of projected volume. That gives you a clearer read on cost per order during slower months, at your base case, and during a growth push - and it shows whether your pricing still works at each level.
Key Points to Carry Into Budgeting and 3PL Planning
Use the monthly total to set budget guardrails and make cleaner 3PL volume assumptions.
Don’t lean on flat per-order averages. They blur what’s actually driving cost. Instead, track activity-based inputs as separate line items, like:
- per-pallet received
- per-item picked
- per-order packed
Keep exception work separate from normal handling. Relabeling, split shipments, and other admin tasks are often billed by the hour, not by the unit. If you lump those into your base model, your monthly invoice can creep up fast.
Returns need their own logic too. Model them by disposition: restock, refurbish, liquidate, dispose. Those paths don’t cost the same, so treating them as one bucket can throw off the math.
Logistics spend usually lands at 8% to 12% of e-commerce revenue, and total fulfillment costs should generally stay under 12% to 15% of order value if you want to protect margins. If your model is drifting above that range, don’t look only at rate cuts. Check packaging, inventory placement, and order profile too.
Then put the model to work in the contract itself. If you work with JIT Transportation, match your forecast to its volume tiers, exception rules, and value-added services from the start. That way, the model reflects your actual contract instead of a blended benchmark.
FAQs
What inputs do I need first?
Start with a baseline from 2–3 years of historical invoice and operational data. Divide total monthly invoices by orders shipped to find your true landed cost per order.
Then pull together the core inputs: order volume, product profile, and current performance. Look at orders per day, lines per order, units per line, channel mix, seasonality, SKU counts, velocity tiers, dimensions, storage media, and SKU master accuracy.
How do I choose pallet, bin, or cubic-foot storage?
Choose based on product size, weight, and how fast inventory moves. Heavy, dense items often make more sense with flat pallet pricing. Small, light goods are usually cheaper to store by cubic foot or per bin.
- Pallet storage: bulk, high-volume items
- Cubic-foot billing: varied or mid-sized products
- Bin storage: smaller, individual SKUs
How should I model peak season and returns together?
Model peak and returns as two linked workload waves in one forecast.
First, forecast outbound for peak weeks by SKU and order mix using base, high, and stress scenarios.
Then layer in the post-holiday returns wave: assume about 30% of holiday orders come back in the two weeks after Christmas. Grade those returns by item condition and the handling steps each one needs, and size capacity for:
- inspection
- disposition
- restock
- refurbish
- disposal
Do that alongside your inbound and outbound plans, so you’re not treating returns like an afterthought when the building is already under pressure.
Related Blog Posts
Related Articles
How 3PLs Personalize DTC Fulfillment
Fulfillment Center Location Strategy: Guide
