Green Last-Mile Delivery for Ecommerce: Guide 2026

Last-mile delivery is where ecommerce brands lose money and add extra CO₂. If I had to sum up the fix in one line, it would be this: place inventory closer to demand, cut bad routes, shrink parcel waste, and make returns move through the same network.
For U.S. brands shipping 3,000+ orders per month, small issues stack up fast. Last mile can account for about 53% of total shipping costs, and in dense urban areas it can drive up to 30% of freight CO₂ emissions. At the same time, shoppers are paying more attention: 57% say they’re quite or very interested in lower-impact home delivery, and 35%+ say they would pay $1–$2 more for it.
Here’s the short version of what matters most:
- Network design comes first. A national DC plus regional staging and urban micro-hubs can cut last-mile costs by 10%–30%.
- Match delivery speed to zone economics. Same-day works in dense urban areas, but it can get expensive fast in suburban and rural zones.
- Use the right mode for the area. Cargo bikes fit dense city cores. Electric vans fit suburbs and larger parcels. Lockers and pickup points cut home-delivery stops.
- Fix failed deliveries. A missed drop-off can cost 2–3x more than a successful one.
- Right-size packaging. Smaller cartons lower DIM weight, trim freight spend, and help fit more parcels into each route.
- Treat returns like part of outbound delivery. Use stores, lockers, and regional nodes to avoid long, messy reverse trips.
- Track a short KPI set. Watch emissions per package, miles per stop, stops per hour, first-attempt success rate, and split-shipment rate.
A few numbers make the case plain:
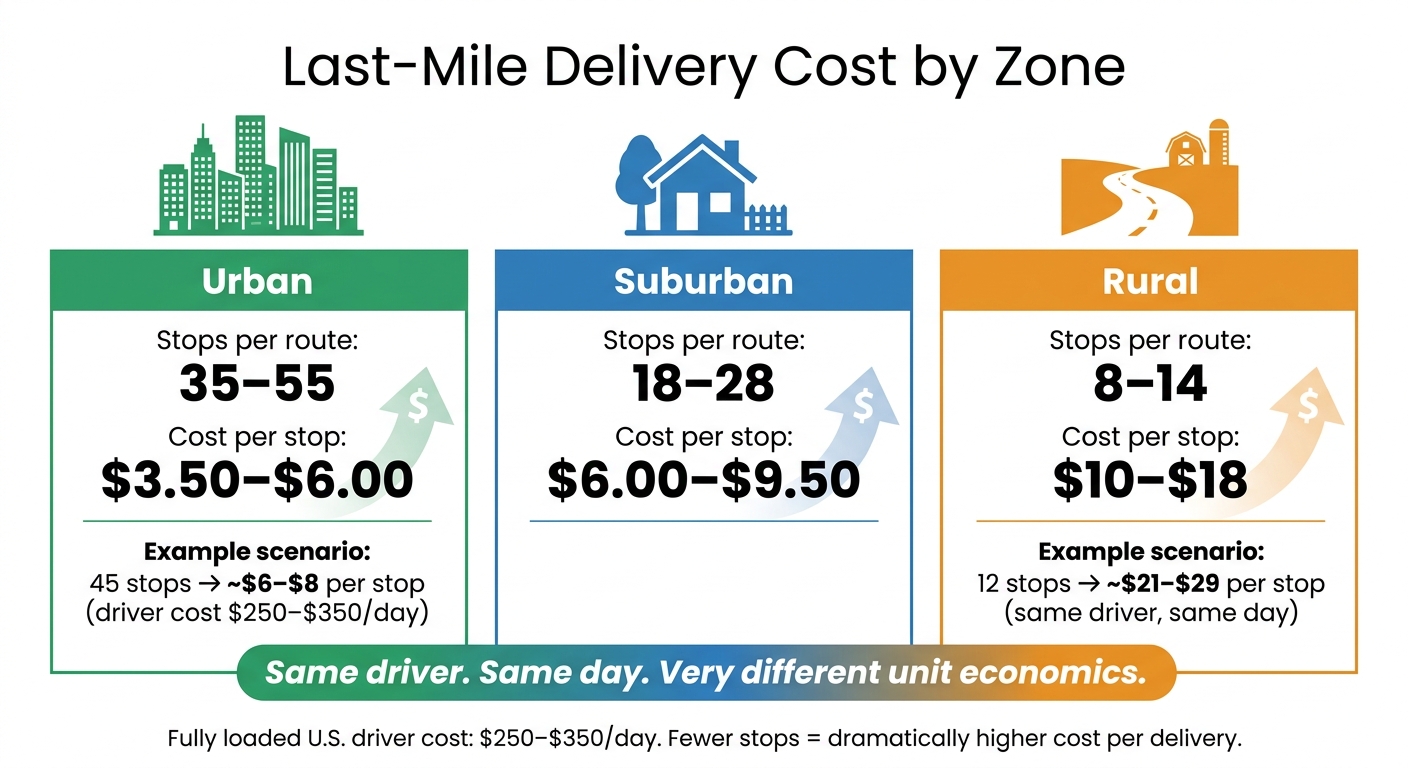
- Urban routes often average 35–55 stops
- Suburban routes often average 18–28 stops
- Rural routes often average 8–14 stops
- At about 45 stops, driver cost may land near $6–$8 per stop
- At about 12 stops, that can jump to $21–$29 per stop
| Lever | What to do | What it helps reduce |
|---|---|---|
| Inventory placement | Use regional staging, micro-hubs, MFCs | Miles, transit distance |
| Delivery mode | Match bikes, EV vans, lockers, pickup to zone | Fuel use, failed stops |
| Service promise | Set ZIP-code delivery rules | Empty trips, low-density routes |
| Packaging | Cut box size and carton sprawl | DIM charges, parcel waste |
| Returns | Route through stores, lockers, regional nodes | Return miles, handling cost |
| Scorecard | Track cost, route, and emissions KPIs | Blind spots in rollout |
If you want greener last-mile delivery in 2026, I wouldn’t start with slogans. I’d start with the map, the route plan, the carton list, and the returns flow.
AI in Sustainable Operations and Last MIle Delivery - Manifest 2026
sbb-itb-eafa320
Design the delivery network to cut miles and increase stop density
Start with network design because it sets the upper limit on emissions and route density.
It shapes travel distance, stop density, and which delivery modes can work. That makes it the first big lever in green last-mile delivery. A common setup is a national DC supported by regional cross-docks and urban micro-hubs placed within 30–50 km of dense demand. That can reduce parcel miles and cut last-mile costs by 10–30%. And when distances shrink, lower-emission options like cargo bikes and small electric vans start to make a lot more sense.
Choose the right node model for each market
Each market needs a node model that fits its demand density. One size does not fit all.
Regional DCs can hold national inventory, but they still need local nodes to keep the final mile short.
Micro-fulfillment centers (MFCs) are small, often automated sites placed close to urban demand. They usually serve a tight 3–6 mile radius. They come with tradeoffs: higher cost per square foot and duplicated SKUs across sites. Still, the emissions upside can be hard to ignore. Research comparing fulfillment models found that an MFC paired with an electric van can reduce per-order CO₂ emissions by up to 85% versus a non-urban DC.
In dense urban markets, MFCs and dark stores often work well. Micro-hubs also fit, especially when parcels can shift to cargo bikes or small EVs for the last stretch.
In suburban markets, a regional DC plus market fulfillment centers - backroom MFCs connected to existing stores - often lands in the sweet spot. The stores are already near customers, so ship-from-store or local pickup can add speed without the cost of new buildings. In rural markets, micro-hubs usually don’t pencil out, so regional DCs with tighter delivery frequency planning and strong vehicle use are the practical path.
Use a 3PL for regional staging and load consolidation
Once the node map is in place, the next step is staging volume across markets without wasting miles.
Building a multi-node network in-house takes a lot of capital and day-to-day coordination. A 3PL with nationwide reach can extend a brand’s network without adding fixed assets. That can include regional staging, load consolidation across shippers, and returns coordination, all without forcing the brand to own every facility.
The green upside comes from consolidation. When a 3PL pools orders from different shippers moving through the same area, trucks leave fuller. Fuller trucks mean fewer total trips, which lowers emissions per parcel. A 3PL can also run cross-dock operations that sort inbound line-haul shipments into directional routes headed to micro-hubs. That avoids the waste of sending parcels back through a central DC first.
A 3PL like JIT Transportation can manage regional staging, load consolidation, and coordinated returns through a nationwide network. Using those same staging nodes for returns also helps avoid fragmented reverse logistics, where single return parcels travel long distances back to a far-off DC.
Ask for reporting on:
- Empty miles
- Load factor
- Mode shift
Match service promises to zone economics
After staging and consolidation, line up delivery promises with what each zone can actually support.
In high-density urban areas near an MFC or dark store, same-day and next-day delivery can be offered at scale because short distances and concentrated demand create denser routes with lower emissions per stop. In those zones, speed and greener delivery can pull in the same direction.
The trouble starts when that same promise gets stretched into low-density suburban or rural zones. If inventory sits far from the customer, same-day can turn into a dedicated or nearly empty route - a driver covering a lot of ground for only a few packages. That hurts stop density and drives up emissions per parcel.
A ZIP-code service matrix helps here. Base it on order density, distance from inventory, and parcel profile. Keep same-day where the network can support it well. Use standard 2–3 day delivery where batching over time is the only way to build a route with enough stops. Bulky SKUs usually need dedicated vehicles, so slower default promises make more sense outside dense zones.
Set allocation rules that prefer one-node fulfillment for multi-item orders, even if delivery is a bit slower. That helps cut split shipments and extra miles.
Build the delivery program: carrier mix, routing, and customer choice
With the network structure set, the next job is deciding how parcels move through it each day: which delivery modes to use, how routes should run, and what customers see at checkout and after they buy.
Assign delivery modes by density, parcel size, and access constraints
Use the density rules from the network plan to match each mode to local demand, parcel size, and access limits.
In dense urban cores like downtown Chicago or San Francisco, cargo bikes and e-cargo bikes are often the best option for small to medium parcels. They sidestep parking problems, move through traffic faster, and can deliver with much lower emissions than diesel vans. Research shows that replacing even 10% of van trips with cargo bikes can cut CO₂ by up to 73%. Pair them with micro-depots or parcel lockers near transit hubs to keep fill rates high and failed deliveries low.
Electric vans make more sense for suburban routes, larger parcels, and places where bike-lane coverage is thin. Parcel lockers and pickup points can cut stop count and move volume away from home delivery. Shifting 50% of home deliveries to pickup points can reduce last-mile CO₂ by 17% across the network, and by about 33% for the parcels that actually use pickup. By 2026, the US has about 170,000 access points, including around 48,000 automated parcel machine locations. Use electric vans with liftgates, or white-glove handling through JIT Transportation, for bulky, fragile, or high-value items.
Once the mode fits the market, routing becomes the next big lever for cutting emissions.
Improve route efficiency and cut failed deliveries
The right vehicle helps, but it won't fix a weak route plan. Poor stop sequencing, vague delivery windows, and bad address data all add miles and cost.
Failed deliveries cost 2–3 times more than successful stops. Start by validating addresses before label creation. Then send SMS and email alerts 12–24 hours ahead, along with real-time ETA updates. Offering customers a precise 2-hour delivery window instead of a loose same-day estimate reduces failed delivery rates by roughly 30%. That keeps missed deliveries down and route density up.
After the routing plan is tightened, checkout rules should guide more orders into those lower-carbon paths.
Use checkout and post-purchase options to shape greener demand
Checkout should guide customers toward the lowest-carbon option the network can support.
Show emissions for each option. That changes behavior better than labels or simple option reordering alone. When slower, consolidated shipping is the preselected default in zones where batching works, more demand shifts toward lower-carbon fulfillment. Pickup incentives and post-purchase controls for rescheduling, pickup, and delivery instructions also help combine stops and cut empty trips.
Those checkout defaults help reduce failed deliveries and keep routes dense.
Cut parcel waste through packaging and reverse logistics
Once routing is locked in, packaging and returns are the next big lever for both emissions and cost.
Right-size packaging and consolidate orders
Oversized boxes quietly eat into margin. In the US, major carriers use dimensional (DIM) weight pricing: length × width × height ÷ 139, rounded up. If that DIM number is higher than the actual scale weight, you get charged the higher one. So box size matters more than many teams think.
A simple carton change shows the impact. Shrinking a box from 18" × 14" × 10" to 16" × 12" × 8" cuts billable DIM weight from 18 lb to 11 lb under FedEx and UPS rules. That's a solid per-shipment gain before you even negotiate carrier pricing.
The same logic applies to accessorial charges. In 2026, UPS and FedEx apply oversize fees at 10,368 cubic inches and large-package surcharges at 17,280 cubic inches or 110 lb. Crossing those limits doesn't just affect sustainability goals. It can change how the shipment gets handled and what it costs.
A tighter packaging setup usually works best:
- Use a small box portfolio matched to order patterns, often four to six core carton sizes tied to SKU families
- Set clear pack-out rules so staff pick the smallest carton that still protects the order
- Use padded mailers or polybags for non-fragile soft goods to cut corrugate use and speed packing
- Switch fragile items to molded pulp inserts instead of loose-fill plastic when protection holds up
Done well, this can move the needle in a big way. One packaging optimization project reported an 89% reduction in shipping damages, a 24% drop in corrugated spend, and $700,000 in annual freight savings.
There's also a network effect here. Smaller, more consistent cartons let more parcels fit into the same van or trailer. That improves load density and cuts miles per package.
Design returns as part of the forward delivery network
Returns shouldn't sit off to the side as their own messy process. They should run through the same network as outbound delivery.
US ecommerce returns generated an estimated 24 million metric tons of CO₂ in 2022. In apparel, transportation can account for up to 90% of the carbon footprint of returns. That makes reverse logistics a transport problem as much as a returns problem.
One practical fix is to send returns through the same regional nodes and drop-off points already used for outbound orders, instead of treating reverse flow as a separate, reactive system.
In-store and partner drop-off locations should be the default option in digital return flows. When customers bring items back to a store, teams can consolidate those units in the back room and move them to regional nodes on scheduled store-to-DC linehauls. In many cases, that adds little extra mileage.
Locker networks work in much the same way. A customer drops off a return at a nearby locker, and the carrier clears many compartments in one stop, often during the same stop used for outbound delivery. That's far more efficient than sending drivers to scattered homes for pickups. Fewer stops, denser collection, lower cost.
Routing rules also need to reflect item condition and local demand. Resalable items should go to the node closest to demand for that SKU, which shortens future forward miles. Damaged items should go to a refurbishment center set up for that work. Unsalvageable goods should head to local recycling instead of taking a long-haul trip to a national warehouse.
3PLs with returns management services, such as JIT Transportation's RMA and pool distribution/consolidation services, can apply those routing rules across regions in a consistent way. That helps each item reach the right disposition stream without extra transit.
To keep improving the system, track a short set of metrics: return transit distance, aggregated return share, and recovery value.
Measure results and scale with a phased rollout
Last-Mile Delivery Cost by Zone: Urban vs Suburban vs Rural
Once network design, routing, packaging, and returns are set, measure all of them with one operating scorecard.
Build the cost model for green last-mile delivery
Start by breaking last-mile spend into unit metrics by zone, carrier, and mode. The main ones are cost per delivery (total last-mile spend ÷ delivery attempts), cost per successful stop (total spend ÷ successful first-time deliveries), and cost per return (total reverse-logistics spend ÷ returns processed).
Stop density affects all three. In dense urban zones, routes usually average 35–55 stops at about $3.50–$6.00 per stop. In suburban zones, that drops to 18–28 stops at $6.00–$9.50 per stop. Rural routes often land at just 8–14 stops, which pushes cost up to $10–$18 per stop.
You can see the math pretty fast. Fully loaded U.S. driver cost often falls between $250–$350 per day. At 45 stops, that works out to roughly $6–$8 per stop. At 12 stops, it jumps to about $21–$29 per stop. Same driver. Same day. Very different unit economics.
Packaging, failed deliveries, and returns need their own line items too. A U.S. apparel brand might carry about $0.65 per order in packaging cost, $0.10 in failed-delivery cost, and $1.40 in returns cost, for $2.15 total per order. That money sits inside last mile, but it often disappears inside blended reporting.
Track the KPIs that show progress
Use the cost model to spot waste. Use KPIs to show whether the fix is working.
Keep the scorecard short. Each metric should have one owner, one target, and one review cadence. During a pilot, review these every week:
- Emissions per package (kg CO₂e)
- Miles per stop
- Stops per hour
- First-attempt delivery success rate
- Split-shipment rate
These measures show whether the pilot is cutting cost and emissions at the same time.
After rollout, move to monthly dashboards for operating metrics and quarterly governance reviews for trend analysis. At that point, add return transit distance and packaging utilization by product category. For emissions per package, calculate route mileage, vehicle type, and energy use, then divide by packages delivered on each route. From there, segment by mode and geography so carrier-mix choices are based on route data, not guesswork.
Roll out in phases: baseline, pilot, expansion, optimization
Once the pilot proves the scorecard works, take the same playbook into similar markets.
Begin with a baseline. Document current route miles, stops per route, stops per hour, vehicle mix, and cost per order by zone. If you skip this step, you won't know whether anything is getting better.
Next, choose one pilot zone and test service and cost assumptions against live data. A cross-functional steering group from operations, finance, sustainability, ecommerce, and customer service should review weekly KPIs and make quick changes when needed.
Then expand into similar markets once the pilot hits target levels for cost per order, emissions per package, and first-attempt delivery success rate. Reuse the network design and carrier mix that worked, then adjust for local density and access limits. After that, optimize each quarter by refining packaging rules and shifting mode mix based on the data you've built up.
3PLs with regional staging and consolidation capabilities, like JIT Transportation, can help support that expansion by applying the same routing and consolidation logic across markets as the program grows.
Network design delivers the biggest gains. Measurement and governance are what keep those gains going.
FAQs
How do I choose the right last-mile model by market?
Match inventory placement, carrier mix, and service-level targets to the demand in each market. Start by mapping orders by ZIP Code so you can spot dense clusters fast.
In urban markets, put electric or hybrid vehicles first for short, frequent routes. In larger regional markets, use a 3PL’s multi-carrier network to balance coverage, cost, and shorter shipping lanes. Set ground shipping as the default, then route each order from the lowest-cost node that still meets the delivery promise.
What should I measure first in a green delivery pilot?
Start with a sustainability audit so you have a clear baseline for your current logistics-related carbon footprint.
Track your total yearly transportation emissions by mode, average shipment distance, warehouse energy use, packaging weight per order, and return rates. Pulling data from carrier invoices, 3PL reports, and utility bills shows where fuel, energy, and materials are being used the most. That makes it much easier to decide what to tackle first based on carbon impact, cost, and how easy each change is to put in place.
How can I reduce returns costs without hurting customer experience?
Focus on stopping returns before they start and making the ones you can’t avoid easier to handle. That means tightening up product descriptions, improving quality checks, and being clear with customers from the start.
A lot of returns happen because the item wasn’t what the buyer expected, arrived with a problem, or got damaged on the way. So the fix often starts upstream.
Use value-added services like:
- testing
- kitting
- white-glove handling
These services can cut down on damage-related returns before the product ever reaches the customer.
When returns do happen, send goods to the nearest recovery node through a 3PL. That can lower transportation costs and reduce the impact of extra shipping miles. It also helps speed up the recovery process instead of sending every return back through one central path.
It’s also worth piloting returns packaging. The goal is simple: protect products better while keeping total cost lower.
Related Blog Posts
Related Articles
How 3PLs Personalize DTC Fulfillment
Fulfillment Center Location Strategy: Guide