
Fulfillment Center Location Strategy: Guide
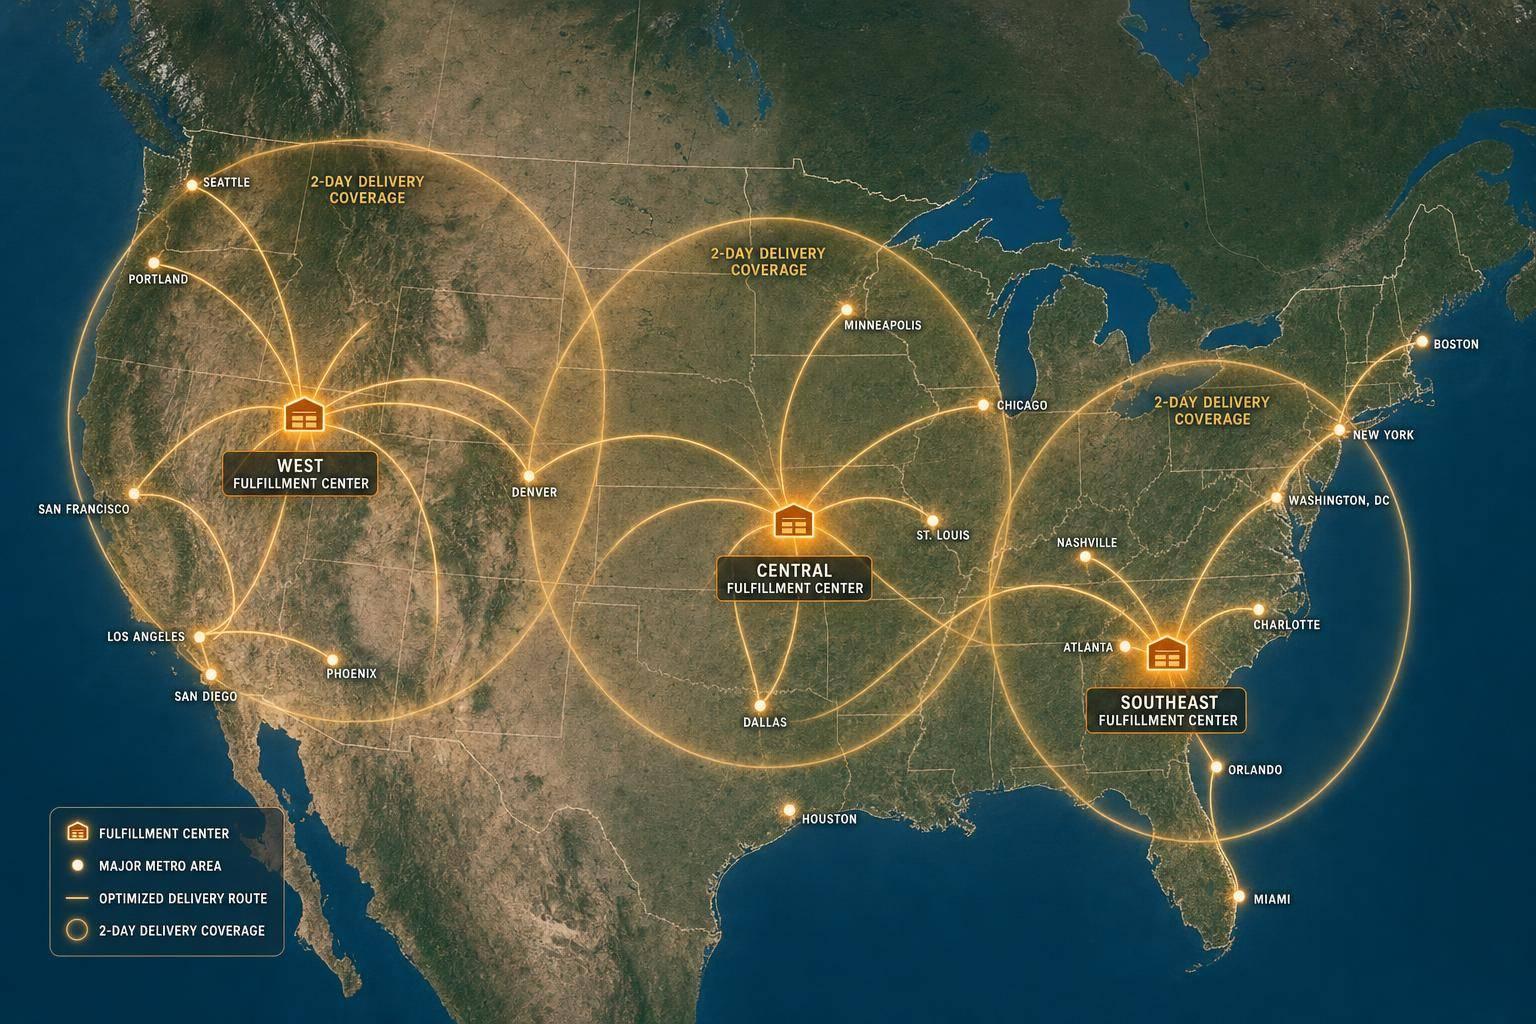
If you ship more than 3,000 orders a month, fulfillment center location can make or break your margins. I’d sum it up like this: put stock closer to demand, keep more orders in Zones 2–4, and use the fewest nodes possible to hit your delivery promise.
Here’s the short version:
- I’d start with 6–12 months of order data to map where customers live
- I’d set a clear target, like 2-day ground for 80%–85% of orders
- I’d check how many shipments now fall into Zones 5–8, where parcel cost and transit time climb
- I’d test whether 1, 2, or 3 nodes cut total cost after adding rent, labor, inbound freight, and extra stock
- I’d stock fast sellers in more than one node, but keep slow movers in one lower-cost site
- I’d add a new node only when savings beat added network cost over 12–24 months
A few numbers stand out:
- Two U.S. nodes can often reach 80%–85% of the population with 2-day ground
- Three nodes can push coverage to about 95%+
- Shifting long-zone shipments into near-zone deliveries can trim $2–$7 per package
- If 40%+ of orders keep shipping in Zone 5 or higher, your network may be too thin
Here’s a quick comparison of common setups:
| Setup | Best fit | Main upside | Main trade-off |
|---|---|---|---|
| 1 node | Lower volume brands | Simple stock control | More Zones 5–8 shipments |
| 2 nodes | Brands chasing 2–3 day ground for most orders | Lower parcel spend on both coasts | More split stock and added facility cost |
| 3 nodes | Higher volume brands, often 250,000+ orders/year | Better national coverage and backup | More inventory and system control needed |
My bottom line: the best footprint is not the biggest one. It’s the one that hits your service goal with the lowest total landed cost, while still giving you backup when demand spikes or a site goes down.
When to Implement a Micro-Fulfillment Center Strategy
sbb-itb-eafa320
Map demand and set service targets before choosing locations
Before you choose a fulfillment location, get clear on two things: where your customers are and what delivery promise you need to keep. Skip that step, and you usually pay for it later through higher shipping costs and missed delivery windows.
Build a demand heat map from 6-12 months of order data
Start with your full order history from your eCommerce platform, ERP, or 3PL system. Pull at least 6 months of data, and 12 months is better. Include ship-to ZIP Code, city, state, SKU, units, and order revenue for each shipment. Before you dig in, clean the file. Standardize state abbreviations, remove test orders, and check ZIP Codes so you're working from actual customer shipments.
Next, group orders by ZIP Code, state, and metro area with a ZIP-to-metro crosswalk. Then roll that up into major clusters such as the Northeast corridor, Southern California, Texas, and the Midwest. For many scaling brands, 3–5 regions account for 60–80% of total volume. That tells you where a fulfillment node can do the most good and helps you avoid spreading inventory too thin.
There’s one catch here. If your data includes a major promotion or some other unusual spike, flag those orders on their own. Outliers can skew the picture and push you to overemphasize a region that doesn’t match your usual demand pattern.
Once demand is mapped, the next move is to define the delivery promise your network needs to hit.
Turn brand promises into measurable delivery targets
After you know where demand sits, turn your delivery promises into clear targets before you start looking at facilities. Set the target first. Then build the network around it.
For many mid-market brands, a common benchmark is 2-day ground delivery for 80–85% of orders, with 3–4 days still acceptable for the remaining long-tail destinations. For VIP or subscription customers, the bar often moves up to next-day or 2-day for 90% or more of orders. Each target should feed straight into KPIs for on-time delivery, air share, and shipping cost as a percentage of revenue.
Then stack those targets against your current zone mix and transit times.
Measure your current zone mix and transit performance
With your demand map and service targets in place, the next step is to measure how your current network performs in practice. Pull carrier invoices or 3PL shipping reports and calculate the share of orders moving in low zones, Zones 2–4, versus high zones, Zones 5–8. Also look at average transit days and cost per order by destination region.
A well-placed network usually has 60–80% of shipments landing in Zones 2–4, with most orders arriving by ground inside the promised window. A problem network looks different. You’ll see a heavy share of cross-country shipments in Zones 7–8, longer average transit times in certain regions, and ground-to-air upgrades cutting into margin just to keep delivery commitments.
When one region keeps showing a large transit gap, that usually points to a missing node or a weak inventory split. That’s where the heat map starts paying off.
Design a U.S. fulfillment footprint around shipping zones, cost, and resilience
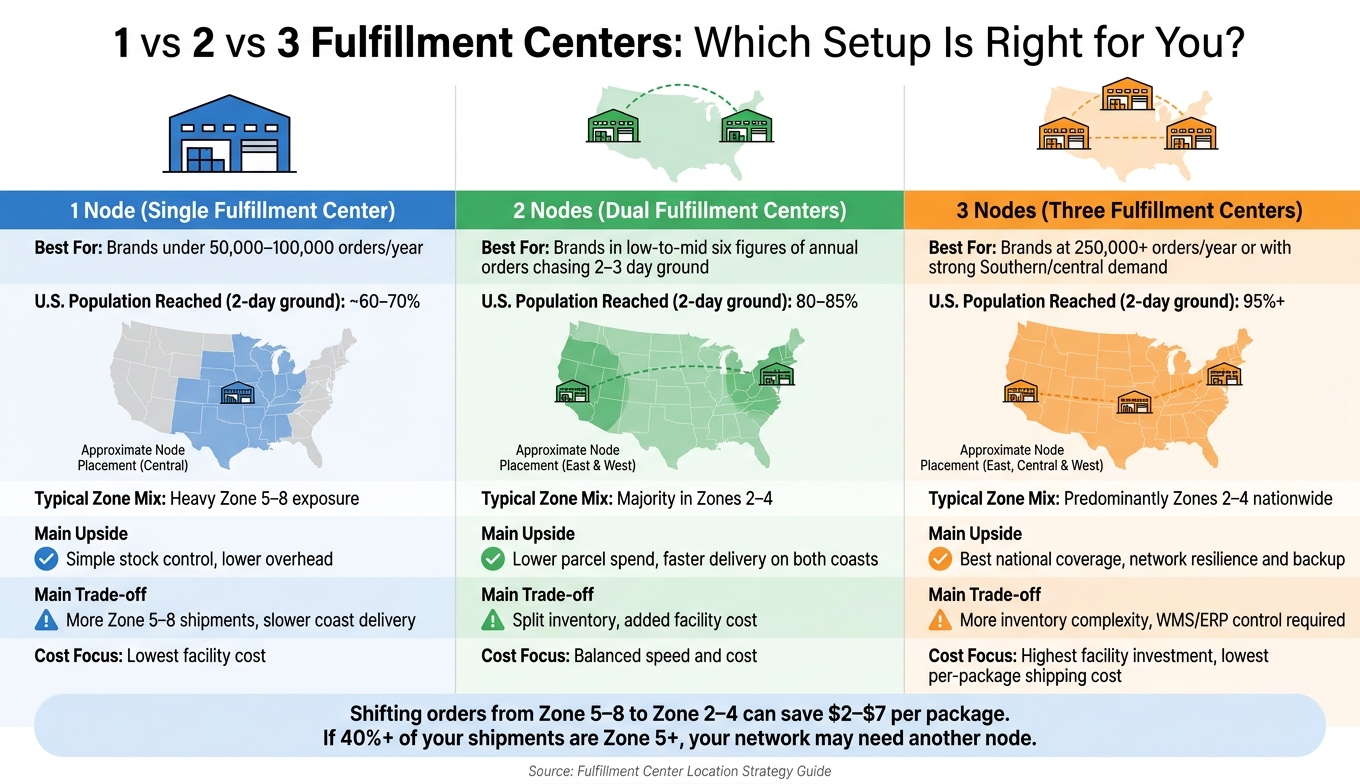
1 vs 2 vs 3 Fulfillment Centers: Cost, Coverage & Speed Compared
If your current zone mix is missing delivery goals, footprint design is usually the lever that fixes it. Once you know where demand sits and what service levels you need to hit, turn that into a network plan: how many fulfillment nodes you need and where they should go.
When one, two, or three fulfillment centers make sense
For brands doing under 50,000–100,000 orders per year, a single centrally located node is often enough. It keeps things simple: one lease, one inventory pool, and one team. The downside is pretty clear. Customers on the coasts often fall into Zones 5–8, which leads to higher parcel costs and slower delivery. This setup is mostly about cost control, not speed.
Once annual volume moves into the low six figures, and you want steady 2–3-day ground delivery for most of the country, a two-node setup starts to look smart. A common approach is one site in the East or Midwest and another on the West Coast. That pairing puts large population centers on both coasts within Zones 2–4 by ground. And two strategically placed warehouses can cover 80–85% of the U.S. population with 2-day ground shipping. That's a big shift because it helps on both speed and cost at the same time.
At 250,000+ orders per year, or when a meaningful share of demand is in the South or central states, a third node can take ground coverage to 95% or more of the U.S. population. It also gives you more resilience. If one site goes down because of weather or a labor issue, the other two can take on more of the load. That kind of backup matters when one bad week can ripple across your whole network.
Next comes the market check: freight access, labor, and risk.
How to evaluate candidate markets in the U.S.
Start with transportation access. Markets close to major parcel hubs often get later carrier cut-off times, more dependable induction, and lower linehaul costs to sort centers. Access to major interstate corridors matters too, both for parcel and for LTL inbound freight. If you import goods, markets near ports and intermodal rail can help cut inbound drayage costs.
Then look at labor and real estate. Check local warehouse wage rates, labor supply, and turnover. Industrial vacancy and average rent per square foot can vary a lot from one market to the next, and property taxes plus utility bills can add up over a multi-year lease. Some states offer tax credits or training support for distribution projects. That's worth noting, but don't chase the biggest package if the market doesn't fit your operation over the long run.
Weather and congestion risk matter too. Hurricanes across the Gulf and Southeast, winter storms in the Upper Midwest and Northeast, and wildfires in parts of the West can all disrupt flow. Map those risks against each candidate market. The point isn't to find a perfect market. It's to avoid putting all your volume in one place that's easy to knock offline. A network split across regions with different risk profiles is a safer bet.
After that, look at what each location does to inbound freight, parcel cost, and network backup.
How placing inventory closer to customers shifts orders into lower shipping zones
Placing inventory closer to customers pushes more orders into lower shipping zones without giving up ground speed. A brand shipping from one Midwest DC will usually see coast-to-coast orders land in Zones 6–8. Add a West Coast node, and many of those California and Pacific Northwest orders can move into Zones 2–4 instead. That change lowers average shipping cost per order and can shave 1–2 days off delivery times in those regions.
To size the upside, pull carrier invoices and calculate your current average cost by zone. Then remap your past orders against candidate facility locations and recalculate the weighted average. Use carrier data to compare sites across a few core factors:
- Zone coverage
- Inbound freight cost
- Labor cost
That exercise turns footprint design from a guess into a numbers-driven decision.
Align inbound freight, inventory placement, and returns with your network
Once your network footprint is set, inbound freight, inventory placement, and returns decide whether the plan holds up in day-to-day operations. Picking the right number of nodes and putting them in the right places is only part of the job. The next gains come from how you supply, stock, and handle returns at each site.
Cut inbound freight costs by mapping suppliers and ports
Start by mapping every inbound lane: origin, port or rail ramp, and final node. For import-heavy brands, nodes near ports or rail-served locations can cut drayage, trim lead times, and lower inbound costs. That matters because site selection shapes more than outbound zones. It also affects drayage miles, receiving speed, and dock flow. So the lane map should guide location decisions, not come after them.
Once the lane map is done, turn it into a routing guide. Spell out preferred carriers and modes by lane, set receiving windows by node and mode, and standardize pallet type, pallet height, and SKU-level labeling. It sounds basic, but these details are where money leaks out. Clear appointment rules and packaging standards can help cut detention fees and improve dock-to-stock performance.
Once inbound flow is under control, the next step is stocking each node based on SKU velocity, not the full catalog.
Stock inventory by SKU velocity instead of copying every SKU to every node
Sending every SKU to every node sounds simple. In practice, it burns cash and clogs space. A tiered stocking model based on velocity and regional demand is the better move.
The top ~20% of SKUs usually drive most order volume, so they belong in every active node with 30–45 days of safety stock per location. Mid-velocity SKUs should go only to nodes where they make up more than 35% of total demand, based on the regional demand patterns already shown in your heat map. Long-tail SKUs can stay at one lower-cost node to protect working capital.
At the node level, set reorder points as daily demand × lead time + safety stock, then use a service-level factor to size the buffer. Recheck SKU classes at least quarterly. A product that looked long-tail six months ago can move up fast after a promotion or a seasonal bump.
After inventory is balanced, returns usually become the next source of pressure on cost and speed.
Choose a returns model that protects speed and margin
Pick the returns model based on volume, product type, and inspection needs. For brands with moderate return rates and simple products like unopened accessories, processing returns at the original fulfillment center keeps freight legs short and restocking fast. For categories like electronics, beauty, and health and wellness, where returns may need testing, tamper checks, or expiration checks, a dedicated returns hub often makes more sense.
Putting inspection and disposition in one place improves consistency, protects margin recovery, and keeps reverse logistics from interfering with outbound work at your main nodes. In other words, returns should be centralized or distributed based on product complexity and reverse-flow volume, not just what feels easiest for the operation.
Whatever model you use, set clear disposition paths from day one:
- Restock
- Refurbish
- Liquidate
- Return-to-vendor
- Scrap
JIT Transportation can manage RMAs alongside forward fulfillment, which keeps returns inside the same workflow. Write the process down clearly so the returns operation can handle volume swings without slowing outbound fulfillment.
Plan for growth with a phased network expansion
Signs it is time to add another fulfillment node
Once your current network is stable, let the data tell you when one node is no longer enough.
One of the clearest signs is too much volume going to Zone 5 or higher. If more than 40% of your shipments keep landing in Zone 5+, you're likely paying too much for parcel shipping and falling short on delivery speed. That usually means it's time to add another node, especially if Zone 5+ shipments lead the mix and your average zone stays above 5.
You can see the same problem in your cost and service numbers. If shipping spend is growing faster than revenue, that's a warning sign. And if you've had to stretch delivery promises from 2–3 days to 4–5 days for a big share of the country, a second node is worth serious modeling.
Peak season often makes the issue impossible to ignore. More overtime, more errors, and earlier cut-off times during Q4 usually mean the facility is being pushed beyond the point where it can run cleanly day after day.
How to expand your network without losing visibility and inventory discipline
The safest way to grow is to do it in phases.
Start with your demand map. Look at where order clusters are and which regions are driving the most Zone 5–8 shipments. Then run the numbers. Model what happens to your zone mix, parcel cost per order, and delivery speed if you place one new node in the region creating the most long-zone volume. Only move ahead if the modeled shipping savings clearly beat the added cost of a second facility, extra safety stock, and WMS and ERP integration over a 12–24 month period.
When it's time to test the idea, keep the pilot tight. Begin with your fastest-moving SKUs instead of copying the whole catalog into the new node. Route a set share of orders there, such as:
- All West Coast orders
- 20–30% of national volume
Then track cost per order, on-time shipment rate, and inventory accuracy every week. If the pilot meets your cost, speed, and accuracy goals, expand lane by lane.
One thing matters the whole way through: every node needs to run from the same WMS and ERP, with real-time inventory updates, the same routing rules, and shared SOPs for receiving, picking, and exception handling. If that piece isn't in place, adding nodes doesn't add control. It adds chaos.
Conclusion: The best location strategy balances speed, cost, and flexibility
The best network is the smallest one that still meets your delivery promise.
FAQs
How do I choose my first second node?
Add a second node when one location no longer supports your goals, which often happens around 200,000 to 1.5 million parcels per year.
For many growing U.S. brands, a bi-coastal East-West setup works well. A common example is New Jersey or Indianapolis paired with Reno or Phoenix.
That kind of split can put 80% to 88% of customers within two-day ground shipping. It may also cut parcel costs by 15% to 20%.
What data do I need to model locations?
Use data from three areas: historical orders, logistics costs, and demand geography.
Pull 90 to 365 days of order data, including customer ZIP codes, order dates, SKUs, units, shipping methods, and fulfillment origins. Then layer in facility, labor, utilities, inbound freight, infrastructure, risk data, growth, and seasonality to spot locations that can improve service levels while cutting total landed costs.
How do I avoid splitting inventory too much?
Use a tiered model based on product velocity.
Keep top-performing items - the top 20% - in all warehouses. Stock mid-tier items only in regions where they account for at least 35% of demand. For slow-moving items, store them in one central hub.
Then route orders to the closest facility that has stock on hand. A centralized order management system helps keep split shipments below 4%.
Related Blog Posts
Related Articles
How 3PLs Personalize DTC Fulfillment
Forecasting Storage, Pick, Pack, and Returns Fees
