How 3PLs Scale Low-Waste Fulfillment Networks

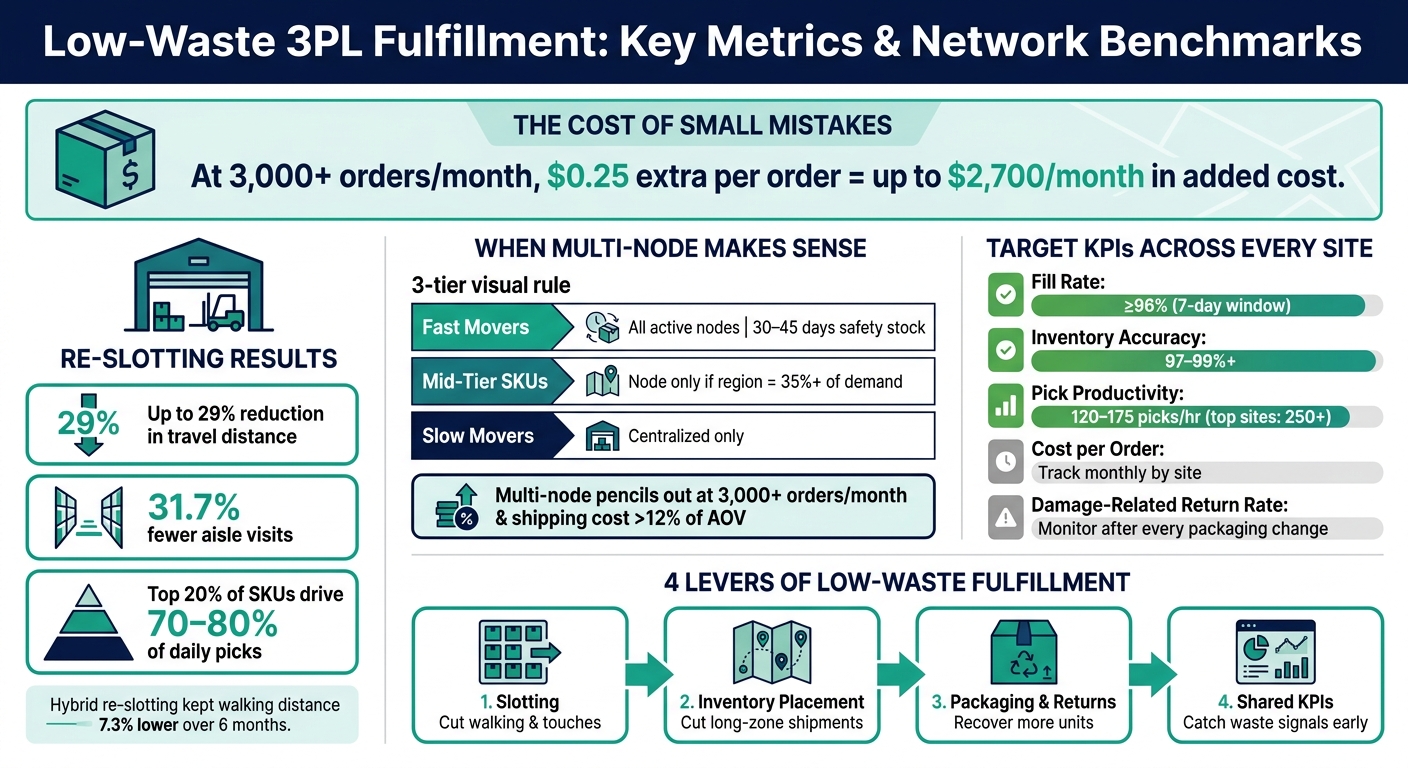
If I ship 3,000+ orders a month, small mistakes stop being small. An extra $0.25 in packaging or $0.40 to $0.60 in shipping per order can turn into $900 to $2,700 per month in added cost.
Here’s the short version: I cut waste in a 3PL network by fixing four things at once:
- Slotting: put fast-moving SKUs closer to pack stations to cut walking and extra touches
- Inventory placement: stock the right items in the right nodes to cut long-zone shipments
- Packaging and returns: set clear pack-out rules and grade returns fast to recover more units
- Shared KPIs: track the same numbers across every site so problems show up early
A few numbers make the case clear:
- Travel can take up about 50% of labor time
- Re-slotting can cut travel distance by up to 29%
- Aisle visits can drop by 31.7%
- Multi-node setups often start to make sense at 3,000+ orders per month
- Fill rate issues should get attention if they fall below 96% over 7 days
- Inventory accuracy should stay near 97% to 99%+
What this means for me is simple: less walking, fewer bad pack-outs, fewer long shipments, and less value lost in returns. The article boils low-waste fulfillment down to the warehouse layout, node rules, packaging controls, returns grading, and network reporting that keep cost per order in check as volume grows.
Low-Waste 3PL Fulfillment: Key Metrics & Network Benchmarks
The E-Com 3PL Playbook: Win Brands, Scale Ops, & Protect Margins
sbb-itb-eafa320
Step 1: Re-slot the warehouse to cut travel, touches, and unused space
Re-slotting is often faster and less expensive than adding more space. Put products where they’re picked, not where they first landed. That layout becomes the baseline for everything else in the network.
Run ABC velocity analysis and map SKU cube
Start with 90 to 180 days of WMS history. Rank SKUs by pick frequency, then place A-items in prime spots: at ergonomic pick height, near pack stations, and along the main pick path. Roughly the top 20% of SKUs drive about 70% to 80% of daily picks.
Then layer in cube, weight, fragility, and handling needs so each item sits in the right storage type. When physical traits match the storage media - like carton flow racks for small fast-movers and pallet rack for bulky reserve stock - you cut travel while also reducing mispicks and damage. That ranking should also guide which items move into forward pick first.
Separate forward-pick from reserve storage
After ranking your SKUs, split picking space from bulk storage. Keep a forward-pick zone close to packing with several days to two weeks of stock for fast and medium movers. Put reserve storage farther back in denser racking, and use WMS min/max replenishment to feed the forward zone.
This setup keeps pickers in a tight, tuned area instead of sending them deep into pallet racking for every order. Start with the top 20% to 30% of SKUs. Re-slotting can cut travel distance by up to 29% and reduce aisle visits by 31.7%.
Build dynamic slotting into peak-season planning
A one-and-done re-slot won’t hold up when demand changes. Slotting needs to be a recurring pre-peak task tied to your peak-season calendar.
Four to six weeks before a major promotion, holiday surge, or product launch, review which SKUs are about to become temporary A-items and move them into the forward-pick zone. Shift slower or out-of-season SKUs back to reserve. In a B2C fulfillment setting, a hybrid approach that mixed periodic re-slotting with steady correction of misplaced locations kept total walking distance 7.3% lower over six months.
If your operation includes value-added services like kitting, assembly, testing, or white glove handling, place those VAS cells next to the main pick-and-pack flow. That way, they don’t interrupt travel or force repacking.
Once pick paths get shorter, network placement becomes the next place to cut waste.
Step 2: Build a multi-node inventory plan that cuts miles and avoids overstock
Once warehouse travel is under control, the next drain on margin is geography. Orders get shipped farther than they need to, and the same SKUs end up sitting in more than one building. A clear multi-node plan helps cut shipping miles, duplicate units, and split shipments.
Map order demand by ZIP code and shipping zone
Start with at least 90 days of order history from your OMS or WMS. For each order, pull the ship-to ZIP code, order date, SKUs ordered, units, shipping method, and the warehouse that fulfilled it. Then map those ZIP codes to carrier service zones and sort orders into distance bands:
- Under 500 miles
- 501–1,500 miles
- Over 1,500 miles from the origin node
This ZIP-level view makes demand clusters much easier to see. If a big share of orders is still moving more than 1,500 miles on ground service, that’s a strong sign that a second node could cut both miles and transit time. Multi-node fulfillment often starts to pencil out once a brand ships 3,000+ orders per month and shipping costs climb above about 12% of average order value.
Once those demand clusters are clear, the next move is deciding which SKUs should live at each node.
Decide which SKUs to stock at each node
Not every item belongs everywhere. The goal is to place inventory where it earns its keep.
Fast movers should go to every active node with 30 to 45 days of safety stock. Mid-tier SKUs should stay at a node only if that region accounts for at least 35% of demand. Slow movers should stay centralized so they don’t turn into dead inventory spread across the network.
Set routing and replenishment rules across the network
This is where the plan becomes day-to-day operating logic. Set reorder points by node, route orders to the closest node that can still hit a 2- to 3-day ground window, and pick the lowest landed cost after factoring in outbound freight, handling, and inventory carrying costs.
A practical formula is: Node ROP = (Node Daily Demand × Replenishment Lead Time) + Node Safety Stock.
If fill rate drops below 96% over seven days, reset transfers or routing before the problem spreads.
A nationwide 3PL like JIT Transportation can help keep replenishment and routing in sync through shared inventory visibility and carrier management.
Those rules only work when every site is working from the same inventory picture and flags the same waste signals.
Step 3: Set Packaging and Returns Rules to Cut Material and Loss from Damaged or Unrecoverable Returns
Once inventory is routed the right way, the next source of waste shows up at the packing bench and after the order lands on the customer’s doorstep. Boxes that are too big can lead to more damage. And if return grading is messy, items that could have gone back into stock end up as a loss.
Set Right-Size Packaging Rules in the WMS
Start with a review of 30–60 days of shipping data. Look for high-volume SKUs with a lot of empty space in their shipments, then map each one to a small, approved pack-out set in the WMS. That usually means trimming packaging options down to a controlled group of carton sizes, mailers, and approved dunnage.
Each SKU should map to one or more approved pack-outs. For example, a single fragile item might go in a small box with paper fill. A three-pack might go in a medium box with an insert tray. The WMS then shows these rules to packers with on-screen prompts and backs them up with scan-confirm checks, so the process holds even during peak volume.
Track these four metrics every month:
- Empty space ratio
- DIM-weight exposure
- Packaging weight per order
- Damage-related return rate
If the damage-related return rate goes up after a packaging change, that’s a red flag. The box may be smaller, but the item isn’t protected well enough.
Those pack-out rules should also account for what happens if the order comes back.
Use Value-Added Services to Cut Repacking and Bundle Waste
Kitting, assembly, testing, and inbound rework can cut down on last-minute bundling and repacking. When inbound product arrives in oversized or non-compliant manufacturer packaging, rework can move it into the approved format before it enters outbound flows. That cuts downstream repacking events.
JIT Transportation can standardize pack-out templates and packaging KPIs across its network.
Build a Graded Returns Workflow That Prioritizes Restock and Recovery
Returns should move through a clear path: RMA, receiving, grading, disposition, and inventory update. Condition grading places each item into a standard tier - A, B, C, or D - with clear rules for what happens next. Depending on grade, that may mean restock, open-box resale, a secondary channel, donation, recycling, or disposal as a last resort.
At the site level, track these three KPIs each month:
- Return cycle time
- Recovery rate
- Landfill diversion rate
When one SKU or one packaging type keeps producing C- or D-grade returns, adjust the outbound pack-out rule. That closes the loop between forward and reverse flows.
Roll these KPIs into a shared dashboard so each site follows the same pack-out and returns rules.
Step 4: Track Cross-Site Data and Improve the Network Over Time
Track One Shared KPI Set Across Every Warehouse
Once pack-out and returns rules are set, track them across every site with one shared KPI set. The goal is simple: make sure local scorecards don't hide waste happening across the network.
Track the same metrics by site and across the full network:
- On-time in-full (OTIF)
- Order cycle time
- Inventory accuracy
- Cost per order
- Picks per labor hour
- Packaging weight per shipment
- Empty space ratio
- Damage rate
- Returns recovery rate
Keep inventory accuracy close to 97%–99%+ and use cycle counts to keep system records lined up with physical stock. Pick productivity often falls in the 120–175 picks per hour range. Top sites can clear 250+, while lower numbers often point to slotting problems or weak pick paths.
Don't stop at the headline number. Break each KPI out by site, SKU family, shipping zone, and channel. That's how you spot the gap between a network number that looks fine on paper and a problem that's piling up at one node or inside one order type.
Review Waste Signals Monthly and Reset Operating Rules
Use those shared metrics in a monthly review so drift gets caught before it turns into network waste. Bring in the brand supply chain lead, 3PL account manager, site operations managers, and data owner. Start with network KPI trends, then dig into the outliers.
Some patterns tend to point to very specific issues.
More Zone 7–8 shipments often means inventory is sitting in the wrong node, so stock should move closer to where demand is clustered. Higher DIM charges or a climbing empty space ratio usually point to cartonization rules that need to be tightened or gaps in carton rule coverage. Repeat damage claims on certain SKUs usually mean the packaging rule needs to change, not that the team should just keep logging claims.
Each review should end with a short action log that names the rule change, the owner, the go-live date, and the KPI expected to move. Then use the next monthly review to check whether the change worked.
Conclusion: What a Scalable Low-Waste Fulfillment Network Requires
The point of shared reporting is straightforward: turn site-level signals into network-wide rule changes.
Low-waste fulfillment scales when slotting, inventory placement, packaging, returns, and reporting run as one system. Cut touches, shorten miles, control pack-outs, recover more returns, and track the same KPIs across every site. JIT Transportation, with a nationwide network and advanced technology across distribution, fulfillment, and value-added services, can support this system by linking site operations to network-wide reporting so waste signals are caught early and fixed before they spread.
FAQs
When should I add a second fulfillment node?
Add a second fulfillment node when one location stops serving your business goals well - not just when order volume goes up.
This move usually makes sense for brands shipping 200,000 to 1.5 million parcels per year. If you place that second node with care, you can cut your average shipping zone and lower parcel costs by 15% to 20%. It can also put 80% to 88% of the U.S. population within two-day ground range.
How often should I re-slot fast-moving SKUs?
Re-slot fast-moving SKUs on a regular schedule based on order velocity. Then back up that schedule with cycle counts. Fast movers are often counted weekly, with changes made after reviewing the results.
In practice, re-slot before demand spikes by watching early SKU-level forecast increases. That helps keep high-demand items closest to shipping during Q4 and other peak periods.
Which KPIs best show waste across 3PL sites?
Track the KPIs that show where work breaks down, slows down, or gets handled more than once across sites:
- order accuracy
- inventory accuracy
- scan compliance
- rework rate
- dock-to-stock time
- fulfillment cycle time
- return processing time
- cost per order (CPO)
It also helps to watch pick and pack time, touches per order, exception triage time, split shipment rate, node stockout rate, and WAZ (weighted average zone).
Related Blog Posts
Related Articles
3PL-Brand Partnerships for Green Supply Chains

Eco-Friendly Packaging for Returns: Complete Guide