Inventory Turnover Calculator
Measure Inventory Performance with Confidence
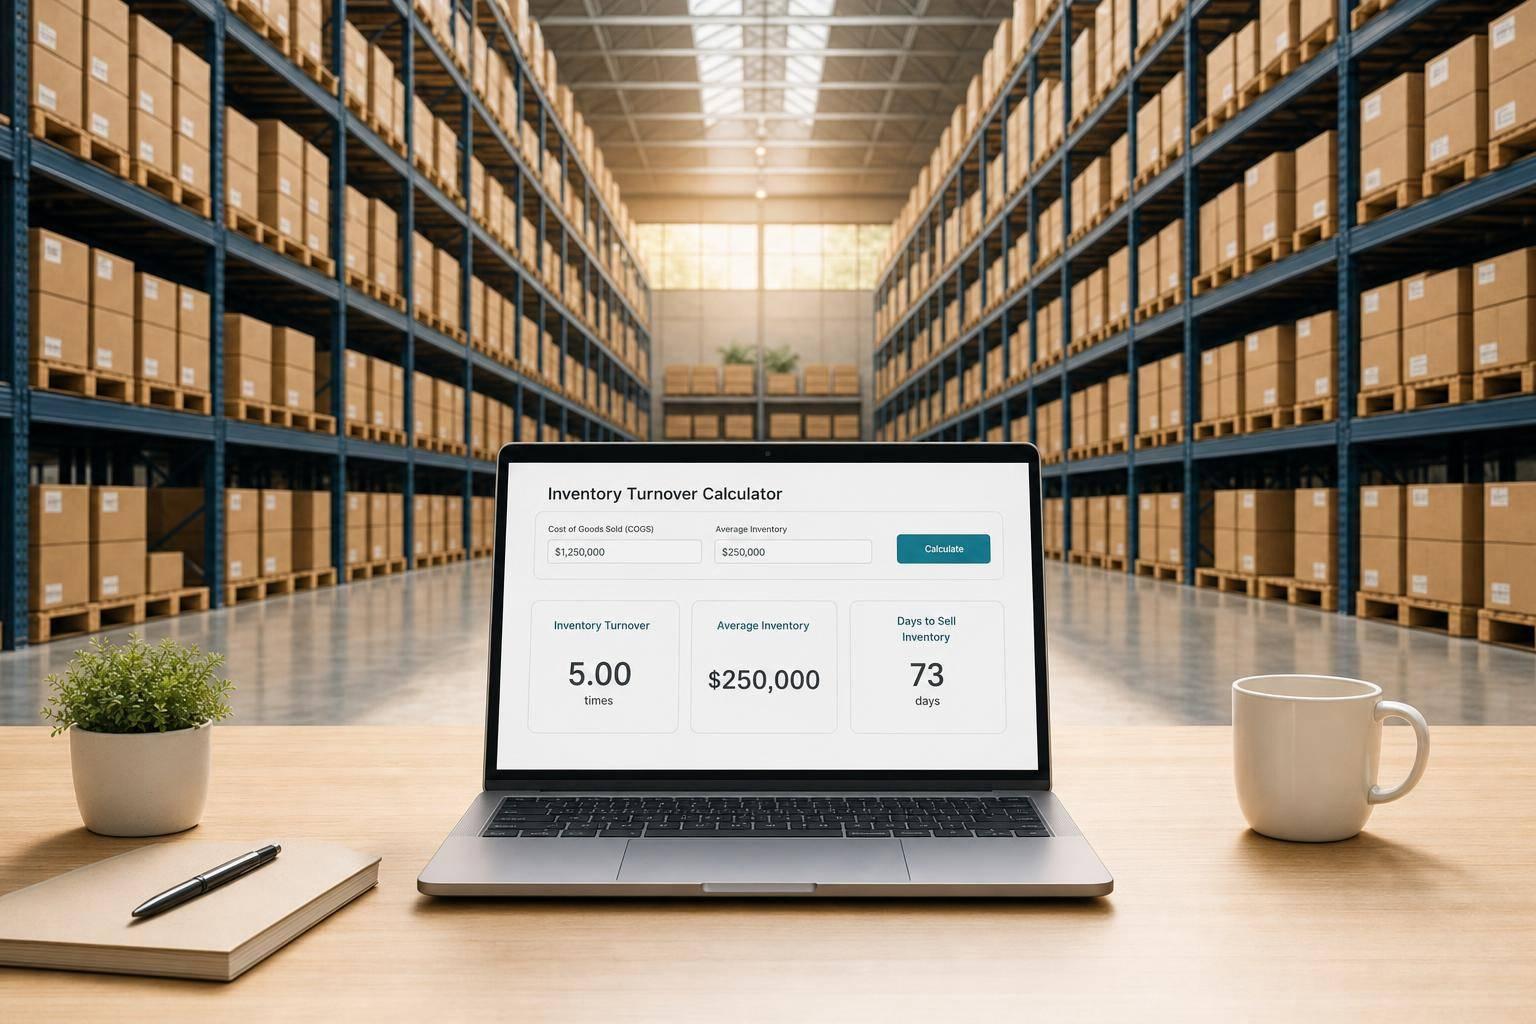
An Inventory Turnover Calculator helps businesses understand how efficiently stock is being sold over a specific period. By comparing cost of goods sold to average inventory, teams can see whether products are moving quickly, sitting too long, or turning at a healthy pace. That makes this metric especially useful for finance leaders, inventory planners, and operations managers who need a clearer view of working capital.
Why This Metric Matters
A strong turnover rate can point to efficient purchasing, steady demand, and leaner inventory levels. A lower rate may suggest overstocking, slower sales, or the need to review product mix and replenishment timing. Looking at days sales in inventory alongside turnover adds even more context by showing how long items typically remain in stock before they sell.
Fast, Practical Inventory Analysis
This inventory turnover calculator keeps the process simple. Enter cost of goods sold, beginning inventory, ending inventory, and the number of days in the period to get instant results. You’ll see average inventory, turnover ratio, and DSI in a format that’s easy to share across finance and operations. For businesses trying to improve stock efficiency, reduce carrying costs, or sharpen forecasting, an inventory turnover calculator offers a quick and practical starting point.
FAQs
What does inventory turnover tell me?
Inventory turnover shows how efficiently a business sells and replaces inventory during a given period. A higher ratio usually suggests inventory is moving faster, which can point to strong demand, better purchasing decisions, or tighter stock control. A lower ratio may indicate slower-moving items, overstocking, weak sales, or product mix issues. The number is most useful when you compare it over time or against industry benchmarks.
How is days sales in inventory different from turnover ratio?
The turnover ratio tells you how many times inventory was sold over the period, while days sales in inventory converts that number into time. In other words, DSI estimates how many days inventory stays on hand before it sells. Many teams find DSI easier to interpret because it answers a simple operational question: how long does inventory typically sit in stock?
What happens if average inventory is zero?
If average inventory is zero, the turnover formula would require division by zero, which isn't valid. In that case, the calculator should return a safe error state instead of showing a misleading result. That usually means one of two things: inventory values were entered as zero for the period, or the data needs to be reviewed for accuracy before using the metric in reporting.
Related Articles

Supply Chain Risk Assessment
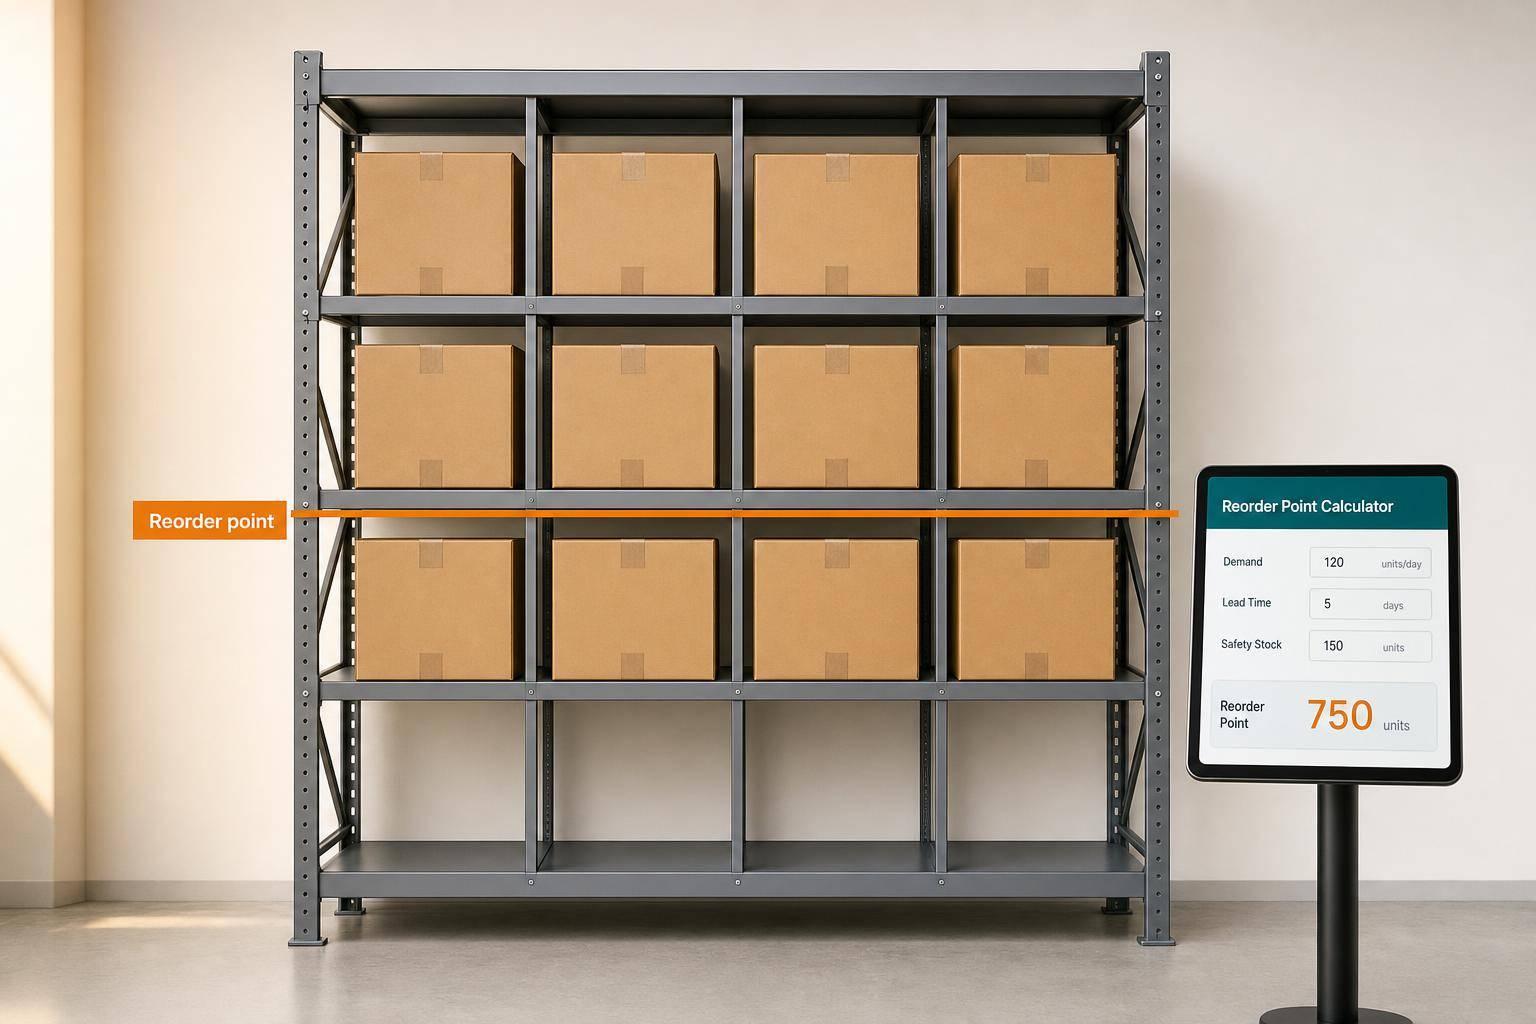
Reorder Point Calculator