JIT Replenishment Metrics to Track in E-commerce
Want to cut costs and improve inventory management in e-commerce? Just-in-Time (JIT) replenishment is all about getting inventory exactly when you need it - no earlier, no later. This strategy reduces warehousing costs, frees up cash flow, and keeps your operations lean. But here's the catch: JIT requires precise metrics to avoid costly stockouts and delays.
Here are the key metrics every e-commerce business should track:
- Replenishment Lead Time: Time from order placement to goods received. Shorter times mean less safety stock.
- Stock Cover in Days: How long current inventory lasts based on sales. Helps prevent stockouts.
- Stockout Rate: Percentage of times items are unavailable. Aim for below 5%.
- Inventory Turnover Rate: Measures how often inventory is sold and replaced. High turnover means better cash flow.
- Sells Out In: Combines on-hand and incoming stock to predict when inventory will run out.
- Replenishment Date: When to reorder to avoid running out of stock.
Tracking these metrics ensures you maintain the right balance - enough inventory to meet demand without overstocking. Tools like ERP systems or WMS can automate calculations, giving you real-time data to make smarter decisions.
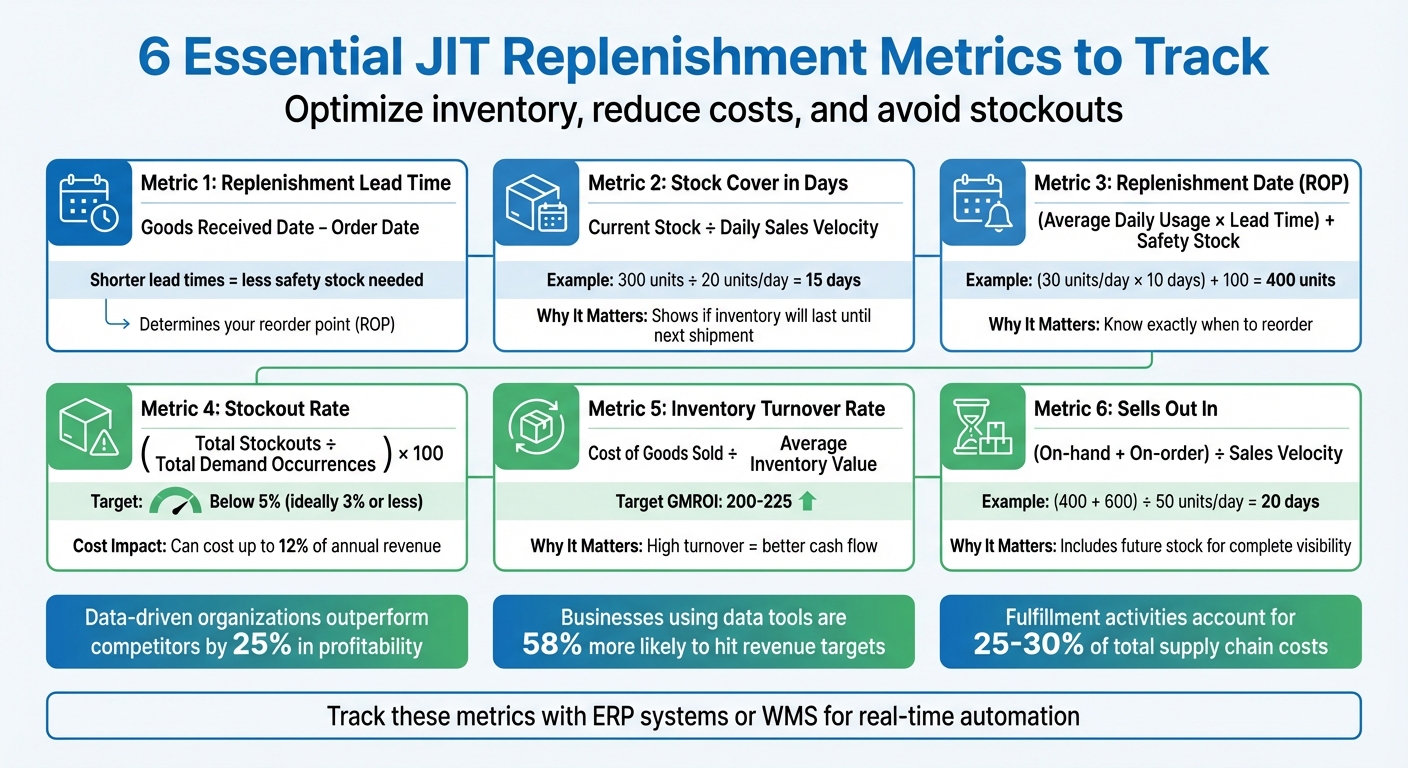
6 Essential JIT Replenishment Metrics for E-commerce Success
Core JIT Replenishment Metrics
Replenishment Lead Time
Replenishment lead time tracks the total time it takes from placing a purchase order to receiving goods that are ready for sale. The formula is simple: Goods Received Date – Order Date. This measure includes every phase - production, shipping, and processing - that determines when inventory is available for customers.
In a Just-In-Time (JIT) system, lead time plays a crucial role in setting your reorder point (ROP), the inventory level that signals when to place a new order. Shorter lead times mean you can operate with less safety stock, cutting down on warehousing costs and freeing up capital. On the flip side, inconsistent lead times increase the risk of stockouts. Sentao Miao, Assistant Professor of Operations Management at McGill University, explains:
Reorder point is calculated based on different factors of cost and risk, such as... ordering lead time. For instance, if the backlog or lost-sale cost is much higher than the holding cost, the retailer should set a higher reorder point to avoid stockout.
To manage this, use historical data to monitor lead time variability and flag unreliable suppliers. Regularly review supplier performance - monthly or quarterly - as it can change over time. Tools like Warehouse Management Systems (WMS) or ERP platforms can automate reorder triggers when inventory hits the ROP, reducing manual delays. Companies like JIT Transportation leverage dependable logistics and shorter lead times to help e-commerce businesses maintain lean inventory while meeting customer expectations.
Once you've analyzed lead times, the next step is to evaluate stock cover in days to ensure your supply matches demand.
Stock Cover in Days
Stock cover in days measures how long your current inventory will last based on your daily sales rate. The formula is straightforward: Current Stock ÷ Daily Sales Velocity. For instance, if you have 300 units and sell 20 per day, your stock cover is 15 days.
This metric helps you avoid stockouts by indicating whether your inventory will last until the next shipment arrives. If your stock cover is 15 days and your lead time is 14 days, it’s time to reorder. Inventory management software can automate these calculations and send real-time alerts when stock levels dip below safe thresholds. Oded Harth, CEO & Co-Founder of MDacne, highlights the value of such tools:
ShipBob's analytics tool... helps us a lot with planning inventory reorders, seeing when SKUs are going to run out, and we can even set up email notifications so that we're alerted when a SKU has less than a certain quantity left.
To keep stock cover accurate, adjust for seasonal sales patterns - like increased summer demand for sunglasses - and include safety stock to handle unexpected demand spikes or supplier delays.
Stockout Rate
Stockout rate measures how often products are unavailable when customers want to buy them. It’s calculated as: (Total Stockouts ÷ Total Demand Occurrences) × 100. A healthy stockout rate for e-commerce businesses is generally below 5%, with some experts suggesting 3% or less.
Frequent stockouts can be expensive. They can cost businesses up to 12% in annual revenue. Beyond immediate lost sales, stockouts erode customer trust and push buyers toward competitors. For example, in 2025, a direct-to-consumer supplement brand faced a 12% stockout rate for its top-selling protein powder. By automating reorder points and adjusting safety stock levels, they reduced their stockout rate to 3%, boosting repeat purchases by 15%.
To address stockouts, use ERP or automation tools to alert you when inventory hits critical levels. Aligning inventory planning with marketing campaigns can also help anticipate demand surges during promotions or influencer partnerships. Regular root cause analysis is essential to uncover whether stockouts stem from supplier delays, inaccurate lead times, or forecasting issues.
Inventory Turnover Rate
Inventory turnover provides a snapshot of how efficiently you sell and replenish stock. The formula is: Cost of Goods Sold (COGS) ÷ Average Inventory Value. A high turnover rate indicates effective inventory management and faster cash flow.
Quick inventory movement reduces holding costs like warehousing and insurance while freeing up capital. A good Gross Margin Return on Investment (GMROI) for inventory ranges between 200 and 225. Ryan Steffenson, Senior Manager of Channel Operations at Tonies, underscores the importance of timely data:
Having this real-time data is crucial for my team, so the fact that there's not hours of lag time waiting for data to update is huge.
Analyze inventory turnover alongside stock cover and lead time to identify slow-moving items that could tie up resources. For industries like fashion or consumer goods, a typical benchmark for Days in Inventory is 30–60 days. Maintaining inventory accuracy above 95% ensures reliable turnover calculations.
sbb-itb-eafa320
Demand Forecasting and Timing Metrics
Sells Out In
The "Sells Out In" metric provides a more comprehensive view than stock cover by including both on-hand and on-order inventory. It's calculated as: (On-hand + On-order) ÷ Sales Velocity. For example, if you have 400 units in stock, 600 units arriving next week, and a daily sales rate of 50 units, your "Sells Out In" figure is 20 days.
This metric helps you gauge inventory availability more effectively by considering future stock commitments. However, relying solely on "Sells Out In" can lead to blind spots. To avoid this, pair it with the "Sells Out In First" metric, which ensures you catch situations where on-hand stock might run out before the next shipment arrives. For reliable forecasting, aim to keep your Inventory Record Accuracy (IRA) at 97% or higher before adopting advanced optimization processes.
Automating your calculations is key here. Use KPI dashboards that pull real-time data from your ERP or WMS to keep metrics updated daily. When prioritizing what to replenish, focus on "Replenishment Profit", which multiplies the number of units to restock by the profit per unit. This approach ensures you’re investing in items that drive the most profit.
Once you've mastered these metrics, the next step is determining the best time to reorder, which brings us to the Replenishment Date.
Replenishment Date
The Replenishment Date pinpoints when to place an order so new stock arrives before your current inventory runs out. To calculate this, use the Reorder Point (ROP) formula: (Average Daily Usage × Lead Time) + Safety Stock. For instance, if you sell 30 units a day, have a 10-day lead time, and maintain 100 units as safety stock, your ROP would be 400 units. This means you should reorder when inventory reaches 400 units.
Lead time variability is another factor to watch. Compare lead times across busy and slow seasons, and use averages from multiple purchase orders for better accuracy. Regularly update your ROP to reflect changes like seasonal demand, market trends, or customer behavior. Inventory management software can simplify this process by automating calculations and sending alerts when stock hits the reorder level, reducing the risk of manual errors.
This level of precision supports Just-In-Time (JIT) practices, ensuring that inventory arrives exactly when needed without excess.
Order Cycle Time
After determining when to reorder, the next step is evaluating how efficiently your order process operates.
Order cycle time measures the total time from placing an order to receiving the goods. The formula is: (Delivery Date – Order Date) ÷ Number of Orders. This metric reveals how well your supply chain is functioning and can also help assess the performance of your 3PL partners. For standard e-commerce ground shipping, a competitive benchmark is often around 2 days.
To identify bottlenecks, break the cycle into three segments: Order-to-Release, Release-to-Ship, and Ship-to-Deliver. Speed up the first segment by automating order validation and credit checks. Use waveless picking in your warehouse to reduce processing times, and consider regional fulfillment centers to cut down on shipping delays. Advanced supply chain technologies, including AI, have been shown to reduce stockouts and lower operational costs significantly.
Shorter cycle times align with JIT goals by freeing up capital tied to slow-moving inventory and boosting turnover rates. To stay ahead of potential disruptions, ensure your systems and 3PL partners are synced in real-time, allowing you to proactively handle issues like carrier delays. Companies like JIT Transportation leverage nationwide networks and cutting-edge technology to help businesses maintain lean inventory strategies while meeting customer expectations efficiently.
KPIs and Metrics for eCommerce | Evaluate Your eComm Performance
Supplier and Operations Performance Metrics
Monitoring supplier performance is a cornerstone for keeping Just-In-Time (JIT) systems running smoothly. Let’s break down three key metrics that help ensure everything stays on track.
Days Inventory Outstanding (DIO)
Days Inventory Outstanding (DIO) tells you how long it takes to turn inventory into sales. You can calculate it using this formula:
(Average Inventory ÷ Cost of Goods Sold) × 365
Or, alternatively:
365 ÷ Inventory Turnover Ratio
For instance, if your average inventory is $50,000 and your cost of goods sold is $365,000, your DIO would be about 50 days. A lower DIO means inventory is moving faster, which aligns perfectly with JIT goals. In industries like fashion and consumer goods, DIO typically falls between 30 and 60 days. The best operations, however, can achieve cash-to-cash cycles in under a month.
To stay on top of slow-moving products, track DIO at the SKU level. Use daily updates and the average of opening and closing inventory to adjust orders quickly. Keeping DIO low not only improves cash flow but also strengthens your bargaining power with suppliers, helping you secure shorter lead times and better terms.
Fill Rate
Fill rate measures how well suppliers fulfill orders and is calculated as:
(Total units received ÷ Total units ordered) × 100
There are two types to consider:
- Unit Fill Rate: Looks at individual items.
- Order Fill Rate: More stringent - an order is incomplete if even one item is missing.
A good target is a fill rate between 95% and 99%. Anything below 90% signals serious inventory risks. For example, Walmart sets a high standard with a 98% On-Time In-Full (OTIF) requirement, penalizing suppliers who fall short. This is critical because 85% of customers are unlikely to return after a poor delivery experience.
To boost fill rates, consider the following:
- Set clear Service Level Agreements (SLAs) with defined goals and penalties.
- Share real-time data with suppliers and use automated tracking tools.
- Build relationships with backup suppliers.
- Use supplier scorecards and conduct quarterly reviews.
Companies that incorporate AI into their supply chains often report fewer stockouts and lower costs, further supporting high fill rates.
JIT Supplier On-Time Delivery Rate
In a JIT system, the timing of deliveries is just as important as the quantity. This metric tracks the percentage of supplier deliveries that arrive within the agreed-upon window. Both early and late deliveries can disrupt operations, especially when warehouse space is limited. Deliveries must meet three criteria: arrive on time, in the correct quantities, and meet quality standards.
For industries like automotive, a strong On-Time In-Full (OTIF) score ranges from 98% to 99%. E-commerce businesses should aim for 92% to 97%. High on-time delivery rates mean less need for safety stock, freeing up capital and avoiding costly production delays. On the flip side, poor reliability can lead to expensive expedited shipping and penalties from retailers.
The benefits of optimizing on-time delivery are clear. Take Nike, for example. In 2012, it introduced JIT practices in its Southeast Asian facilities, cutting lead times by 40%, increasing productivity by 20%, and speeding up new product launches by 30%. Similarly, Harley-Davidson USA reduced on-hand inventory by 75% through JIT, saving on warehouse costs and improving responsiveness to orders.
To avoid disputes over delivery metrics, standardize "On-Time" and "In-Full" definitions in your SLAs. Automated alerts for shipments that deviate from schedules can help you respond quickly, whether by rerouting or notifying customers. Use ABC analysis to prioritize high-value items, ensuring the most critical deliveries stay on schedule. Companies like JIT Transportation use advanced technology and nationwide networks to help businesses maintain reliable delivery rates, ensuring inventory arrives exactly when it’s needed.
Conclusion
Tracking JIT metrics is essential for running a profitable e-commerce operation. Without these metrics, decisions are often based on guesswork rather than hard data. As Simon Wheeler, Chief Sales and Marketing Officer at J&J Global Fulfilment, puts it:
Strong fulfillment operations run on data. Without accurate metrics and clear reporting, you're running on faith and instinct.
The numbers back this up. Data-driven organizations can outperform competitors by up to 25% in profitability, and businesses using data tools for decision-making are 58% more likely to hit their revenue targets. Monitoring key metrics consistently - like keeping a stockout rate below 5%, maintaining an inventory turnover of 6–8 times annually, and achieving on-time delivery rates above 95% - has a direct impact on cash flow and customer satisfaction. Considering that fulfillment activities can account for 25% to 30% of total supply chain costs for e-commerce retailers, even small improvements in accuracy or efficiency can significantly boost profitability.
To unlock these benefits, you need the right tools and expertise. Effective metric management demands integrated systems, real-time data visibility, and specialized support. A trusted 3PL provider like JIT Transportation can bridge these gaps. With advanced technology, a nationwide network, and scalable solutions, JIT Transportation eliminates data silos and provides actionable insights across your supply chain. Their services - including distribution, fulfillment, and value-added options like pick & pack and kitting & assembly - help businesses meet the tight delivery schedules and inventory precision required for JIT strategies.
The road to sustainable growth begins with measurement. Focus on mastering critical metrics, automate reporting to flag issues early, and collaborate with logistics partners who deliver the reliability your JIT strategy demands. When metrics are accurate, the results are clear: better cash flow, happier customers, and a stronger operational foundation.
FAQs
How does JIT replenishment help e-commerce businesses save on warehousing costs?
JIT replenishment is a game-changer for e-commerce businesses aiming to cut warehousing costs. By replenishing inventory only when it's needed, businesses can avoid storing large quantities of products. This not only slashes storage expenses but also reduces the risk of holding onto items that might become outdated or unsellable.
Beyond cost savings, JIT replenishment simplifies operations. With less inventory to manage, handling costs decrease, and valuable warehouse space is freed up for other uses. This approach creates a more efficient supply chain, allowing businesses to allocate resources wisely while trimming unnecessary expenses.
What tools can help automate JIT replenishment metrics for better inventory management?
Automating JIT replenishment metrics simplifies inventory management by delivering real-time data and minimizing human errors. Modern tools rely on data analytics and algorithms to keep an eye on inventory levels, sales patterns, and lead times, ensuring restocking happens right when it's needed.
These systems often integrate directly with warehouse and order management platforms, creating an efficient and connected workflow. They can handle tasks like automatically generating purchase orders, monitoring performance metrics, and offering predictive insights. This helps businesses maintain the right stock levels and operate more efficiently. By using automation, your JIT strategy can stay on track and adjust to shifting demands effortlessly.
Why is it important for e-commerce businesses to minimize stockouts?
Minimizing stockouts is critical for e-commerce businesses. Running out of inventory doesn’t just mean missed sales - it can also erode customer trust. Research indicates that stockouts can cause up to 20% in lost sales, and worse, drive over a third of customers to turn to competitors instead.
Keeping stockouts to a minimum helps safeguard revenue, improve customer satisfaction, and foster long-term loyalty. Implementing a dependable replenishment strategy, like Just-In-Time (JIT), ensures inventory levels match demand, helping businesses avoid both overstocking and shortages.
Related Blog Posts
Related Articles
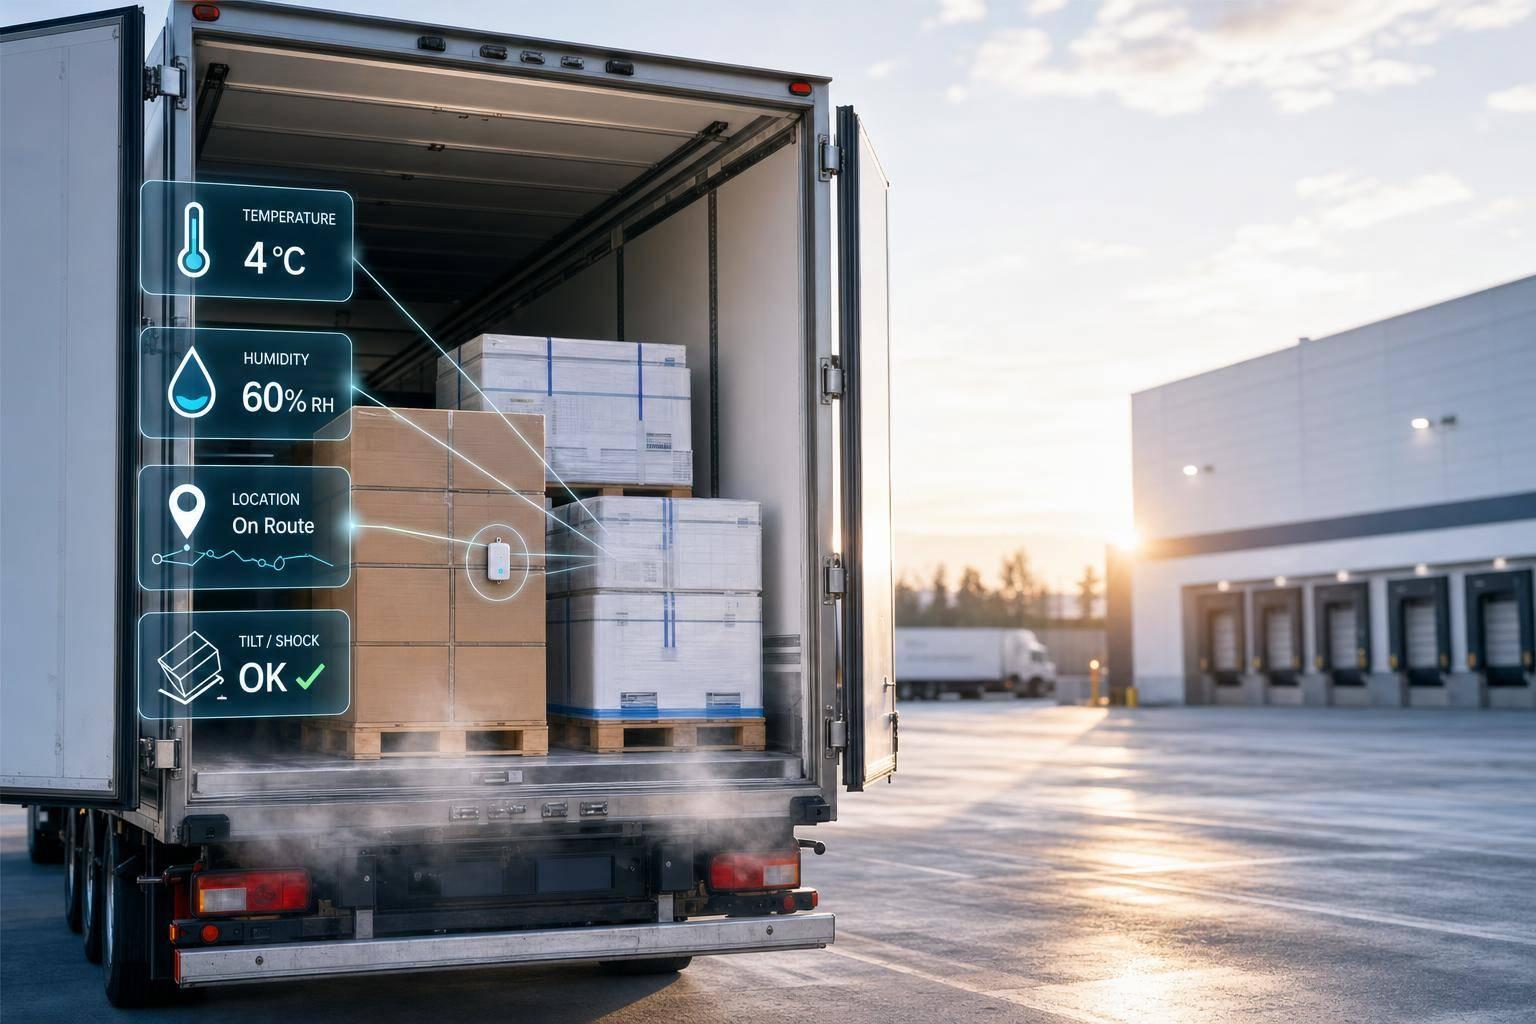
Ultimate Guide to IoT Sensors in Cold Chain Logistics
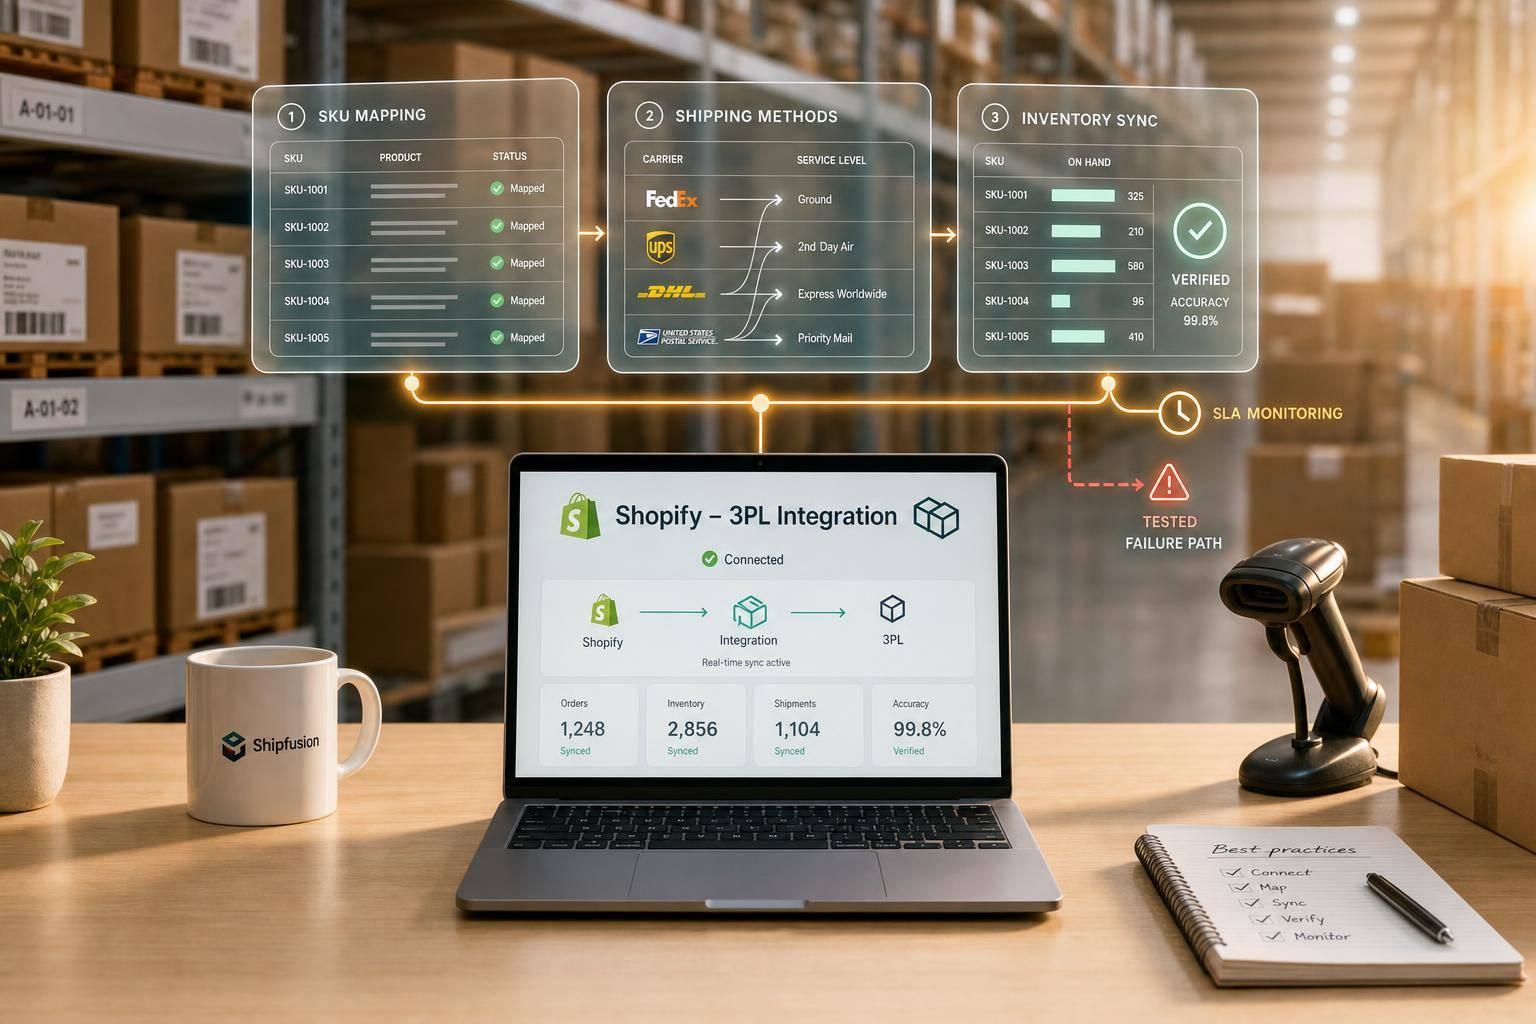
Shopify 3PL Integration: Best Practices