How to Measure Customer Satisfaction in 3PL

Customer satisfaction in third-party logistics (3PL) is crucial for retaining customers and protecting your business's profitability. Key metrics like on-time delivery, order accuracy, and customer feedback reveal how well your 3PL provider is performing. Here’s a quick breakdown:
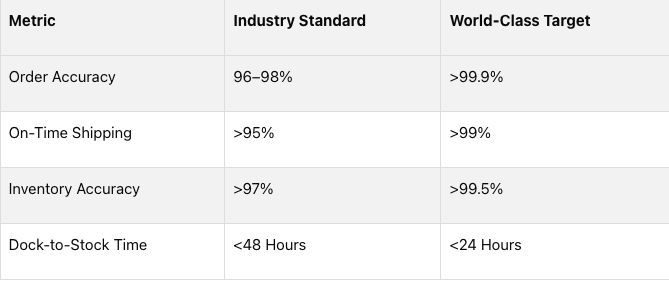
- On-Time Delivery (OTD): A reliable 3PL should achieve at least 95% on-time delivery, with top providers hitting 98% or higher. Late deliveries can drive away up to 69% of customers.
- Order Accuracy: Industry leaders maintain accuracy rates above 99.9%, ensuring correct items and quantities are shipped. Errors can reduce profitability by 13% per order.
- Customer Feedback: Tools like CSAT (Customer Satisfaction Score) and NPS (Net Promoter Score) help measure satisfaction and loyalty. Surveys should be sent within 24–48 hours of delivery.
- Return Rates: High return rates (e.g., above 16.9% for e-commerce) often signal fulfillment issues like incorrect shipments or damaged goods.
Using advanced tools like Warehouse Management Systems (WMS) and real-time dashboards can help track these metrics, identify issues early, and hold your 3PL accountable through Service Level Agreements (SLAs). These steps ensure smooth logistics, protect your brand, and maintain customer trust.

Key 3PL Customer Satisfaction Metrics and Benchmarks
Customer Satisfaction: Metrics That Matter + How to Improve Them
sbb-itb-eafa320
Step 1: Track On-Time Delivery Rate
On-time delivery (OTD) tracks whether your 3PL delivers orders by the promised dates. This metric is a clear indicator of how well operations are running. Think about it: when you promise a customer their order will arrive by Thursday, 17% of customers will stop buying from you after just one late delivery. Miss two or three deadlines, and over 50% of customers will abandon your brand. These numbers highlight why accurately measuring OTD is so critical.
For fast-growing e-commerce brands offering 2-3 day delivery windows, every hour matters. Your 3PL must process orders quickly enough to meet carrier cutoffs. If they miss those cutoffs, even the best-performing carriers can’t make up for the delay. That’s why the responsibility for maintaining fulfillment speed - the time from order placement to carrier pickup - rests squarely on your fulfillment partner.
How to Calculate On-Time Delivery Rate
The formula is simple: (On-Time Deliveries / Total Deliveries) × 100. An order is considered "on-time" if it reaches the customer on or before the promised date. Be sure to clearly define what counts as "on-time" for your business, including any exclusions for uncontrollable factors.
A reliable OTD rate should hit 95% or higher. Falling below this threshold signals significant issues, whether it’s poor inventory management, warehouse inefficiencies, or flawed routing processes. The best 3PLs achieve rates of 98% or higher. Consistently meeting this target not only fulfills your service commitments but also boosts customer satisfaction and loyalty. To stay on track, you’ll need dependable tools to monitor this metric.
Tools for Monitoring On-Time Deliveries
Modern Warehouse Management Systems (WMS) offer real-time insights into fulfillment performance. These cloud-based systems track every step of the process, from order entry to carrier pickup, helping you identify delays before they affect customers. Look for dashboards that display live data on key metrics like picking speed, packing throughput, and carrier handoff times.
A good WMS can also provide merchant portals where you can access live order data and quickly resolve issues like incorrect shipping addresses. For example, T'SAS Produce Delivery implemented OptimoRoute for automated route planning. As a result, they handled the same volume of orders with 10 trucks instead of 12 and saw a 75% drop in delivery-related customer complaints.
"Straight away we could fit the same amount of orders into 10 trucks instead of 12 trucks."
Step 2: Measure Order Accuracy Rate
Order accuracy is just as important as on-time delivery when it comes to keeping customers happy in 3PL operations. This metric tracks whether the right items, in the correct quantities, with proper documentation, are picked, packed, and shipped to the intended destination. It’s a direct reflection of how well your operations are running. Mistakes here don’t just cost time and money - they also chip away at customer trust. Returns, rework, and support tickets pile up, making errors expensive in more ways than one.
The connection to customer satisfaction is crystal clear. Imagine receiving the wrong item or an incorrect quantity. Now, you’re stuck contacting support, setting up a return, and waiting for a replacement. For customers, this hassle can be a dealbreaker, turning loyal buyers into critics who might share their frustrations online. That’s why tracking order accuracy isn’t optional - it’s a must for maintaining trust.
How to Calculate Order Accuracy Rate
Here’s the formula to measure order accuracy:
(Accurate Orders / Total Orders) × 100
An "accurate" order means everything checks out - correct item, quantity, documentation, and destination. Industry benchmarks are tough: 99.9% overall accuracy and over 99% for shipping precision. These high standards highlight how even small errors can lead to big problems.
Reducing Fulfillment Errors
To cut down on mistakes, use tools like barcode scanning during picking and packing. Adding pack validations as a final check ensures items and quantities align with order details before they leave the warehouse. These steps are especially important during busy seasons when errors are more likely to slip through.
Some common culprits behind fulfillment errors include unclear bin locations, inconsistent staff training, and poor scan compliance. A modern Warehouse Management System (WMS) can help solve these issues by providing real-time insights into labor and orders. This lets you track key metrics and step in before service levels drop.
Teaming up with experienced 3PL providers, such as JIT Transportation, ensures these advanced tools and processes are built into every stage of fulfillment. This not only strengthens your logistics operations but also protects your brand and helps avoid costly returns.
Step 3: Collect Customer Satisfaction Feedback
While tracking delivery times and order accuracy gives you hard data, direct customer feedback provides a window into how people feel about your 3PL service. Sending surveys after delivery lets you capture real-time insights - whether packages arrived intact, delivery times met expectations, or the overall experience left a positive impression.
Surveys also create a feedback loop with your 3PL provider. For example, if customers report damaged packaging or unclear tracking updates, you can address these issues before they become bigger problems. Considering that around 55% of customers may stop buying from a brand after multiple late deliveries, catching dissatisfaction early is key to keeping them loyal. Below, we’ll cover how to design effective surveys and analyze the feedback you collect.
Using Surveys to Measure CSAT
Customer Satisfaction Score (CSAT) measures how happy customers are immediately after an interaction, such as receiving their order. To get accurate responses, send surveys via email or SMS within 24–48 hours of delivery. Keep them short - long surveys can discourage up to 20% of customers, and 67% may abandon them entirely.
Stick to straightforward questions like, "How satisfied were you with your delivery?" or "Was your package in good condition?" Use a mix of rating scales (e.g., 1–5 stars) and a couple of open-ended questions to gather more context. An 80/20 balance of closed-ended to open-ended questions works best for actionable insights. Since 60% of surveys are completed on mobile devices, ensure yours are mobile-friendly. Features like large tap targets and minimal clutter make it easier for customers to respond quickly.
In the logistics and 3PL industry, CSAT scores between 80% and 90% indicate strong performance. If your scores fall below this range, dive into the open-text responses to identify recurring issues like late deliveries, poor packaging, or unclear communication.
Analyzing CSAT and Net Promoter Score (NPS)
While CSAT captures immediate satisfaction, Net Promoter Score (NPS) provides a longer-term view of customer loyalty. NPS gauges how likely customers are to recommend your service by asking, "How likely are you to recommend us to a friend?" This metric predicts repeat business and word-of-mouth potential. For repeat buyers, sending NPS surveys quarterly or every 3–6 months helps track how relationships evolve over time.
Using CSAT and NPS together gives you a fuller picture. CSAT can flag operational issues early, while NPS shows how those issues might impact overall loyalty. For instance, if CSAT is high but NPS is low, it might mean customers are satisfied with individual orders but hesitant to recommend your service overall.
To get the most out of survey data, link it to your logistics KPIs, such as shipping accuracy and delivery times. If a customer leaves a poor rating, cross-check their feedback with warehouse data to uncover potential issues like picking errors or delays. This approach allows you to turn feedback into actionable improvements. Modern warehouse management systems can even integrate survey data with fulfillment metrics, helping you pinpoint exactly where problems arise.
At JIT Transportation, we make it a priority to combine customer feedback with our operational data. This ensures we’re constantly refining our processes and delivering the high-quality service our clients expect.
Step 4: Monitor Return Rate and Customer Feedback Trends
Returns can be a clear indicator of problems in your fulfillment process. In 2024, e-commerce retailers dealt with an eye-popping $890 billion in returned products, with average return rates hitting 16.9% and spiking to 30% during peak seasons. When return rates rise, it's often a sign of underlying issues, such as incorrect shipments, damaged goods, or unclear product descriptions - all of which can point to flaws in your 3PL (third-party logistics) operations.
The financial burden of returns is no small matter. They can eat up anywhere from 20% to 65% of an item's original price after factoring in shipping, restocking, and loss of value. Even worse, 67% of customers are unlikely to shop with you again after a poor return experience. This makes tracking return rates critical - not just for cutting costs but for maintaining customer trust and loyalty.
How to Calculate Return Rate
Here’s the formula: (Total Returns / Total Units Sold) × 100. For example, if you shipped 1,000 units last month and 150 were returned, your return rate would be 15%. Compare this percentage to your industry benchmarks and historical data. If you notice a jump - say, from 12% to 22% in a single quarter - it’s time to investigate.
Pay close attention to the reason codes customers select when initiating returns. Many RMA (Return Merchandise Authorization) systems allow customers to choose from options like "wrong item shipped", "defective product", or "size/fit issues". This structured data is invaluable for spotting trends. For instance, if "wrong item shipped" complaints surge during a particular week, cross-check that period with your warehouse’s picking accuracy logs. This can help you identify whether the issue stems from a training gap or a process failure. Tracking these metrics alongside others in your operations will give you a clearer picture of what’s going wrong.
Identifying Feedback Trends
Beyond tracking return rates, it’s essential to keep an eye on customer feedback across various platforms. Scan online reviews, social media, and support tickets for recurring complaints. For example, if multiple customers mention "crushed boxes" in their reviews, it’s a strong signal that your packaging might need an upgrade.
Link this feedback to your key performance indicators. If complaints about late deliveries are on the rise, compare them to your on-time delivery rate for the same timeframe. This approach allows you to turn anecdotal feedback into actionable insights. Regularly review these trends with your customer service, warehouse, and product teams to identify and resolve issues. For example, monthly meetings to analyze return reasons can help you address problem areas before they snowball.
At JIT Transportation, we take an integrated approach by combining return data with our warehouse management systems. This allows us to detect patterns in real time - whether it’s a specific product line with higher return rates or recurring complaints about packaging. By acting quickly, we can adjust our processes and prevent these issues from escalating further.
Step 5: Use Dashboards for Continuous Metrics Review
Relying on monthly metrics is simply too slow - by the time you spot a problem, the damage to customer experience has already been done. The trend in the industry is moving toward real-time dashboards, which shift the focus from reacting to problems to preventing them in the first place. By integrating data from systems like WMS (Warehouse Management Systems), TMS (Transportation Management Systems), and API/EDI connections, you can track key metrics such as OTIF (On-Time, In-Full), CSAT (Customer Satisfaction), return rates, and NPS (Net Promoter Score) in one consolidated view.
Why is this so crucial? Because delays in identifying issues can be expensive. For instance, 16% of shoppers abandon a retailer after just one incorrect delivery, and 69% are less likely to shop again if their delivery is late. Add to that the fact that a single picking error can cost around $42, and it becomes clear: real-time monitoring isn't just helpful - it saves money and protects customer loyalty.
Setting Up Dashboards for Real-Time Data
To ensure your dashboards deliver accurate, actionable insights, they should rely on scan-based processes rather than outdated paper-based methods. Paper processes introduce errors and can lead to costly mistakes.
Connor Perkins from G10 Fulfillment puts it plainly: "You want everything to be scanned in the warehouse, nothing done on paper. You can lose a lot of money in this industry by having people ship stuff wrong or store it incorrectly, and now it's lost somewhere".
For maximum effectiveness, enhance your dashboards with advanced visualizations. Use scatter plots to assess employee productivity, tree maps to understand warehouse occupancy, and segmented data to identify regional bottlenecks or shipping channel inefficiencies. Compare performance across time periods - like this week versus last week - to quickly spot trends or dips in performance. When metrics fall below set standards, apply the '5 Whys' technique to uncover whether the issue is isolated or part of a larger, systemic problem.
Additionally, consider offering a customer portal that provides real-time updates on order statuses, inventory levels, and KPIs. This eliminates the need for manual reporting and improves transparency. Some dashboards even include merchant portals that allow clients to address issues instantly, like correcting a failed shipping label, which ensures faster resolution and keeps things running smoothly.
Continuous monitoring through these dashboards is key to maintaining the high standards that protect customer trust and preserve your brand's reputation.
Establishing SLAs with 3PL Providers
Once real-time dashboards are in place, you can use the data to strengthen accountability with your 3PL (third-party logistics) partner by formalizing Service Level Agreements (SLAs). These agreements should clearly define service expectations, performance goals, reporting schedules, and any incentives or penalties tied to meeting - or missing - those goals. For example, Amazon requires third-party sellers to maintain an OTIF compliance rate of at least 90%, while FedEx achieves an on-time delivery rate of about 98%. Leading 3PL providers aim for an order accuracy rate above 99.9%.
At JIT Transportation, we work closely with clients to create SLAs that reflect their specific business priorities. For instance, a luxury brand might prioritize order accuracy over cost, so we use weighted scorecards to assign different levels of importance to each KPI. Metrics like dock-to-stock time, which we aim to keep under 24 hours, and return rates tied to 3PL errors are closely monitored to ensure alignment with both operational goals and customer satisfaction.
Dashboards aren’t just for tracking; they’re tools for action. Use them to validate your 3PL’s performance and guide regular check-ins. Weekly operational meetings, monthly deep dives into KPIs, and quarterly business reviews (QBRs) create a structured framework for transparency and accountability.
 Source:
Conclusion
Every step outlined in this guide - from tracking on-time delivery and ensuring order accuracy to gathering customer feedback - builds a complete picture of customer satisfaction. In the world of 3PL, success hinges on a system where every metric works together to enhance performance. Accurate orders help retain customers, while timely deliveries encourage repeat business. Monitoring returns and listening to customer feedback highlight problem areas, and real-time dashboards turn insights into proactive solutions instead of reactive fixes.
This approach not only strengthens customer trust but also impacts your bottom line. For instance, a single order error can reduce profitability by 13% due to returns and added costs. Retail returns alone accounted for $890 billion - 16.9% of annual sales - underscoring the financial stakes. Leading 3PL providers consistently achieve near-perfect accuracy and dependable, fast deliveries.
"JIT consistently ensures seamless operations and strong supply chain performance."
This level of reliability highlights the importance of partnering with a 3PL provider that prioritizes continuous improvement. A partner like JIT Transportation doesn’t just track metrics - they consistently meet them. With a nationwide network, cutting-edge technology, and expertise in material handling, JIT Transportation provides the operational clarity and dependability needed to protect your brand and maintain customer loyalty.
Outstanding 3PL performance comes down to consistent and proactive operations. Choose a partner capable of identifying issues early, excelling during high-demand periods, and offering real-time transparency to support confident decision-making. This level of consistency, driven by diligent performance tracking, forms the foundation of a successful e-commerce business.
FAQs
What should I include in a 3PL SLA to protect customer satisfaction?
To ensure customer satisfaction within a 3PL SLA, it's essential to include measurable metrics that define service expectations. Here are some key ones to consider:
- Response Times: Set clear limits on how quickly issues should be resolved to avoid delays.
- Inventory Accuracy: Implement real-time tracking requirements to minimize stockouts and errors.
- On-Time Delivery Rates: Aim for high delivery performance, with targets like 95-99%.
- Order Accuracy: Establish strict benchmarks, such as 99.5-99.9%, to reduce mistakes in order fulfillment.
- Returns Management: Outline efficient processes to handle returns, especially if return volumes are high.
Regularly monitoring these metrics ensures service levels stay consistent and meet customer expectations.
How do I separate 3PL-caused delays from carrier or weather delays in my KPIs?
To spot delays caused by your third-party logistics provider (3PL), focus on tracking key performance metrics. Look at dock-to-stock time, accuracy variance, and on-time delivery rates. Compare planned delivery schedules with actual outcomes and analyze trends. For example, delays during severe weather might point to external challenges, whereas repeated problems in routine operations could highlight issues with your 3PL's internal processes. Establishing clear benchmarks for these metrics can make it easier to pinpoint where delays are happening in your supply chain.
Which dashboard metrics best predict customer churn in 3PL fulfillment?
Key metrics that can help anticipate customer churn in 3PL fulfillment are order fulfillment accuracy, on-time shipping rate, and inventory accuracy. These metrics have a direct impact on customer satisfaction and loyalty, making them critical for evaluating performance and tackling potential problems before they escalate.
Related Blog Posts
Related Articles

Cross-Border Demand Forecasting: Guide For 3PL Teams

Forecast Models for Seasonal E-commerce Peaks