Shift Planning for Seasonal Demand in Warehouses
If warehouse volume jumps by 30%, a weak labor plan shows up fast in overtime, missed ship times, and tired teams. I’d handle peak by forecasting labor by task, adding backup headcount, opening the right mix of core, peak, and flex shifts, and tracking shift-level KPIs every day.
Here’s the short version:
- I’d use at least 3 years of WMS or ERP data to find peak weeks, days, and shifts.
- I’d plan labor for inbound, outbound, returns, and VAS, not just picking and packing.
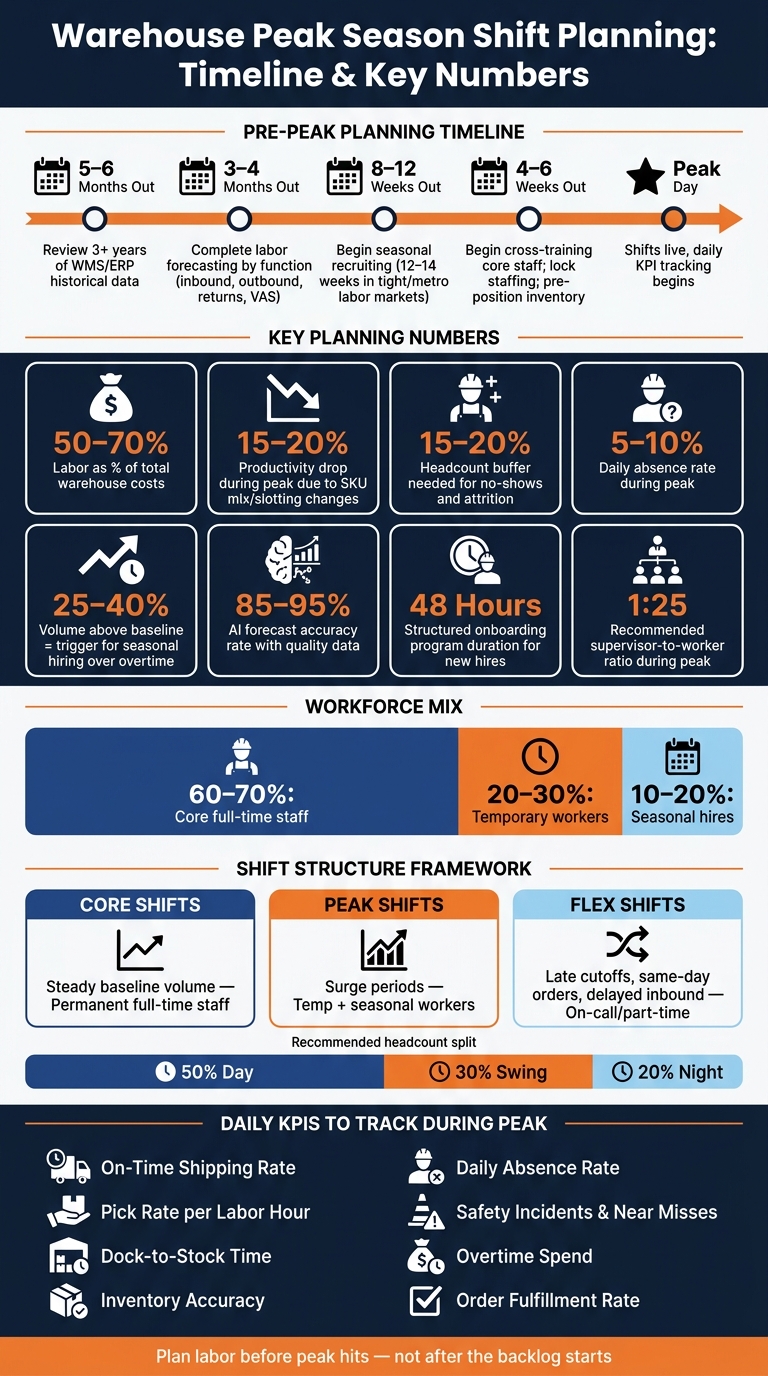
- I’d adjust for a 15%–20% drop in productivity when SKU mix or slotting gets harder.
- I’d add a 15%–20% headcount buffer for no-shows and turnover.
- I’d start recruiting 8–12 weeks before peak, or 12–14 weeks out in tight labor markets.
- I’d use overtime for short spikes, but shift to seasonal hiring when volume stays 25%–40% above baseline.
- I’d cross-train core staff 4–6 weeks before peak and give new hires a 48-hour onboarding plan.
- I’d watch on-time shipping, pick rate, dock-to-stock time, inventory accuracy, absences, and safety by shift.
What this means in plain English: you need a shift plan that matches when work hits the building, not one that gets fixed after the backlog starts.
A few numbers stand out right away. Labor can account for 50% to 70% of warehouse costs for brands shipping more than 3,000 orders per month. During peak, daily absence can run 5% to 10%. And if your team is working 10- or 12-hour shifts, break timing and job rotation matter if you want to keep errors and injuries down.
I’d think about shift planning in four parts:
-
Know the demand
- Find peak windows by week, day, and shift
- Map inbound receipts, returns, promotions, and carrier cutoffs
- Build a U.S. peak calendar around dates like back-to-school, Black Friday, Cyber Monday, Thanksgiving week, and year-end clearance
-
Build the shift structure
- Set core shifts for steady work
- Add peak shifts for surge periods
- Use flex shifts for late cutoffs, same-day orders, and delayed inbound
- Test day, swing, and night coverage against dock and carrier schedules
-
Staff the floor
- Keep harder tasks with experienced workers
- Use temp labor for simpler, high-volume work
- Cross-train before peak starts
- Set rules for when managers can add overtime, reassign labor, or open extra shifts
-
Run peak day by day
- Review staffing daily
- Replan during the shift when volume moves off forecast
- Audit results after peak and update next year’s playbook
This article is a practical summary of how I’d turn seasonal demand data into a shift plan that covers receiving, putaway, picking, packing, shipping, returns, and kitting without leaving blind spots.
Warehouse Peak Season Planning Timeline & Key Metrics
Understand Your Seasonal Demand Profile
Use Historical Order and Labor Data to Find Peak Windows
Start with at least three years of WMS or ERP data, broken out by week, day, and shift. That view helps you spot where volume jumps, how SKU mix changes, and which shifts burn the most labor hours. From there, turn projected unit volume into labor hours by function using your actual UPH for receiving, putaway, picking, packing, and shipping.
Then pressure-test the math for peak season. A plan that works in a steady month can fall apart fast during a surge. Unfamiliar SKU mixes and weak slotting can drag productivity down by 15–20% versus your baseline. So adjust labor hours before you set headcount.
Next, divide those adjusted labor hours by productive hours per associate after breaks, huddles, and training. That gives you your base headcount. After that, add a 15–20% buffer for no-shows and attrition.
These demand peaks are what you’ll use to shape shifts in the next phase.
Account for Inbound, Returns, and Value-Added Workload
A lot of peak plans miss the mark in the same way: outbound is sized well, but inbound, returns, or VAS get shorted. That’s a problem because inbound, returns, and VAS all pull from the same labor pool as outbound. If one area gets squeezed, the slowdown doesn’t stay there for long. It spreads.
Use your data to see which roles get tight first. That’s where you need backup before bottlenecks start rolling across the floor.
Returns are a common weak spot. Post-holiday volume jumps in January, and the work isn’t light. Testing, restocking, and disposition all need dedicated headcount. Value-added services such as kitting, assembly, and repackaging make planning harder too. These jobs have their own UPH rates, often lower than standard picking, and they often need dedicated workstations.
On top of that, promotions and carrier cut-off times can squeeze all this work into short windows. That’s why per-shift labor modeling needs to be precise, not rough.
Build a U.S. Seasonal Demand Calendar
Map each peak date to recruiting, shift adds, and inventory pre-positioning. In the U.S., the big volume drivers often include:
- back-to-school
- Thanksgiving week
- Black Friday
- Cyber Monday
- year-end clearance
The labor plan has to line up with those dates, not chase them after the fact.
Work backward from each peak date and set hard deadlines. Start recruiting 8 to 12 weeks before the peak date, and start 12 to 14 weeks out in competitive metro markets. Keep the milestone calendar tight:
- review historical data 5 to 6 months out
- finish labor forecasting 3 to 4 months out
- begin seasonal recruiting 8 to 12 weeks out
- lock staffing and pre-position inventory 4 to 6 weeks out
Use this calendar to decide when peak shifts should open, when flex coverage needs to come in, and when staffing has to be locked. That’s the bridge from demand timing to shift structure.
sbb-itb-eafa320
Build a Flexible Shift Framework
Define Core, Peak, and Flex Shifts
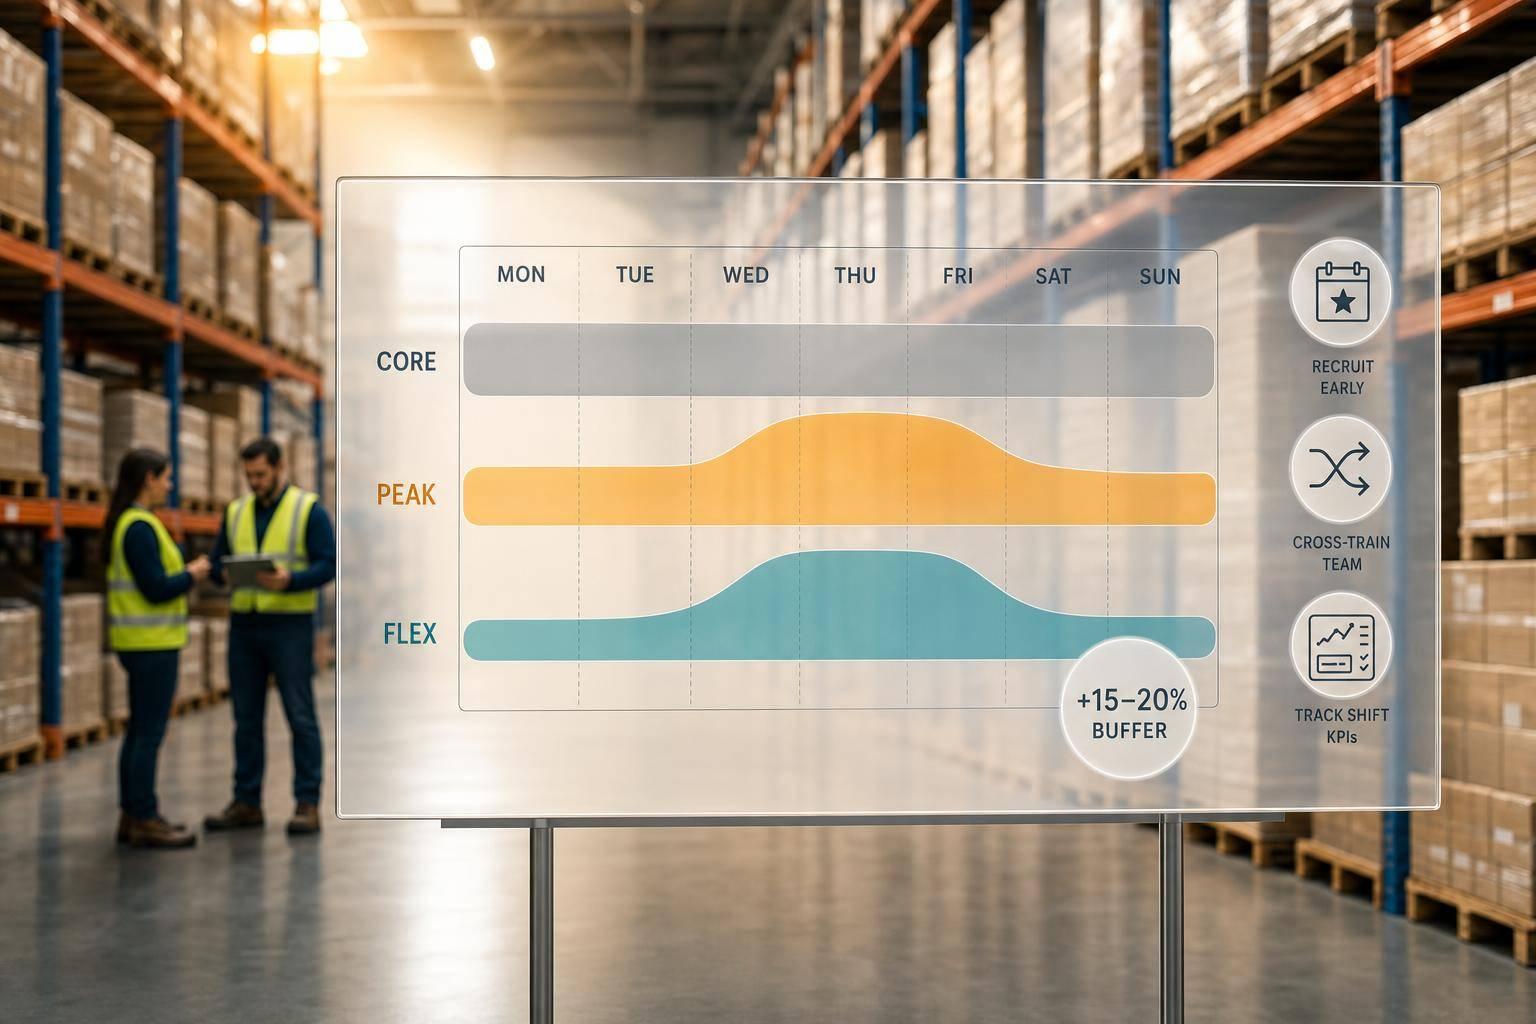
Once you've mapped your peak windows, build your shift plan around them. A solid framework has three layers: core shifts for steady volume, peak shifts for surges, and flex shifts for late cutoffs, delayed inbound, and same-day orders.
Core labor should handle most of the work. Then use temporary and seasonal workers to fill peak gaps. From there, line up each layer with carrier cutoffs, dock appointments, and same-day volume so labor shows up where the pressure hits.
Match Shift Patterns to Outbound and Inbound Flow
Outbound runs on carrier departures and pick wave schedules. Inbound runs on dock appointments and receiving windows. Those two flows often spike at different times, which is why one flat shift structure can clog the operation.
A practical starting point is a 50% Day / 30% Swing / 20% Night headcount split, calibrated against your dock cutoffs. That setup lines labor up with carrier departures, receiving windows, and the handoffs between shifts.
Those overlap windows matter a lot. If the handoff is loose, throughput slips. If it's planned well, work keeps moving instead of piling up.
Set Rules for Overtime and Seasonal Labor
Overtime is useful as a short-term buffer. If volume jumps for a few days around a holiday, it can close the gap.
But if demand stays high - generally when volume is running more than 25–40% above baseline - long stretches of overtime start driving fatigue, turnover, and labor cost per order in the wrong direction. That's usually when seasonal hiring makes more sense.
Staggered or overlapping shifts work well for high-volume pick waves and carrier cutoffs because they cover handoffs and cut bottlenecks. Weekend-focused schedules can clear backlogs and help protect Monday shipping SLAs. Short flex shifts are a good fit for late cutoffs or delayed inbound loads when you need extra coverage without committing to a full-day shift.
Use a tiered forecast - steady state and sustained volume above baseline - to decide when the next staffing layer should turn on. Set trigger points for each tier so managers can move to the next labor layer right away.
Align Staffing, Skills, and Training to Peak Workloads
Map Roles by Process and Shift
Once your shift layers are in place, map each role to each shift and skill level. Then use your forecasted labor hours to put the right people on the right process at the right time.
For peak, a solid workforce mix is usually 60–70% core full-time staff, 20–30% temporary workers, and 10–20% seasonal hires. That mix helps you keep steady coverage while still adding extra hands when volume jumps.
Use temporary workers for high-volume, lower-complexity work like packing, labeling, and basic sortation. Keep your experienced permanent team on higher-complexity tasks such as zone picking, RF scanner operation, and forklift support. It’s a simple idea, but it matters: don’t put your newest people on the work that can slow the whole floor.
Cross-Train Employees Before Peak Starts
Cross-train the roles most likely to turn into bottlenecks during peak. When permanent staff know the building and the WMS well enough to move between tasks, you can shift labor without dragging down the rest of the operation. Cross-trained associates can step into problem areas and keep the shift moving.
Start cross-training core staff 4–6 weeks before peak begins. Focus on the two or three activities most likely to jam up, like picking and packing. A tiered model works well here. Entry-level tasks such as basic packing take about 2 hours to learn, while higher-complexity roles like zone picking or RF scanner operation need 2–5 days of ramp time.
Don’t rush new workers into harder jobs. Wait until they’ve shown steady performance on simpler tasks for at least 2–3 days before moving them into more demanding work.
Plan Hiring, Onboarding, and Safe Execution
After you map roles and skills, close the remaining gaps through hiring, onboarding, and safety coverage. Work backward from your peak start date to schedule recruiting, background checks, orientation, and training.
Add a 15–20% headcount buffer above your calculated need to absorb no-shows and early turnover. In peak planning, that buffer can save you from a bad week fast.
Treat onboarding like part of production, not admin work. A structured 48-hour onboarding program should cover safety protocols, equipment use, and role-specific task training. Pair each new hire with a mentor, and lower that mentor’s target for the first one to two weeks. That gives new people support without putting too much pressure on output right away.
For 10- or 12-hour shifts, plan breaks and ergonomic rotation to cut fatigue, injuries, and quality errors. During peak, a good supervisor-to-worker ratio is 1:25. You should also expect a 5–10% daily absence rate and plan around it. To cut no-shows and early turnover, use attendance incentives like $50–$100 weekly bonuses or prize drawings.
Use Technology and Data to Improve Scheduling
Connect WMS, Labor Tools, and Scheduling Workflows
Once core, peak, and flex shifts are in place, the next step is assigning labor hour by hour. This is where connected systems make a big difference. Manual spreadsheets just can't keep up during peak season. When order volume changes by the hour, your systems need to share data with each other. Linking your WMS, labor management system (LMS), and scheduling workflow gives supervisors real-time visibility into attendance, schedules, and worker performance.
When order volume and work queues flow straight into the scheduling workflow, teams can build demand-first labor plans. For example, you can feed expected UPH by activity into the scheduling workflow so it calculates the labor hours needed for each shift. That gives you a much better starting point than copying last year's headcount. Modern WMS tools can also send demand signals by tracking changes in order velocity, which helps teams spot labor gaps and stockout risk before those issues turn into service problems.
Forecast Labor Needs and Run What-If Scenarios
AI-driven models that pull in WMS history, marketing calendars, and carrier cutoffs can reach forecast accuracy rates of 85% to 95% when the data is solid. They can also reduce errors by 20% to 50% compared with older forecasting methods.
The point of forecasting isn't just to make a plan and walk away. It matters when it leads to fast staffing decisions. AI and machine learning tools let leaders run best-case, likely-case, and worst-case scenarios, then adjust fast when there's a sudden demand spike, a carrier delay, or a system outage. And here's the part teams often miss: if demand shifts or the SKU mix gets more complex, UPH can fall by 15% to 20% versus baseline assumptions. That's why your scenarios need some buffer built in from the start.
Track Real-Time KPIs and Use External Capacity When Needed
During peak, the most useful metrics are the ones that show where service levels are starting to slip. Track these by shift:
- Order fulfillment rate - on-time, complete orders
- Inventory accuracy - catch data issues early
- Pick rate per labor hour - spot productivity changes
- Dock-to-stock time - find receiving delays
- Work queues by area - move cross-trained staff where needed
Use those signals in daily staffing reviews so you can move labor before service slips.
When internal capacity hits its limit, an outside partner can take some of the pressure off. JIT Transportation can support seasonal capacity planning through distribution and fulfillment, transportation, and value-added services like pick and pack and kitting.
Monitor In-Season and Improve the Next Plan
Run Daily and Weekly Staffing Reviews
After forecasting and scheduling, the job shifts to daily control. Once peak begins, shift planning stops being a set-it-and-forget-it task. It becomes a day-by-day operating rhythm.
Use intraday replans when disruptions hit, daily stand-ups to check plan-vs.-actual variance, and a Monday/Thursday lock each week to finalize weekend labor. Those reviews should lead to same-day labor moves, not fixes pushed off to next week.
When actual pick rates or inbound volume move off plan, supervisors usually have three levers they can pull right away:
- Open a flex shift
- Reassign cross-trained workers to the bottlenecked area
- Approve limited overtime
Measure Peak Outcomes Across Cost, Service, and Safety
Track shift-level metrics across service, cost, and safety to see if the labor plan is holding up.
On the service side, watch on-time shipping and order fulfillment rate. On the labor side, track pick rate, units per labor hour, and MAPE by process step. On the cost side, monitor overtime spend and agency labor premiums. On the attendance and safety side, keep an eye on no-show rates, safety incidents, and near misses.
High-pressure peak periods increase the risk of safety incidents, so output should never come at the expense of safe execution. Use this scorecard to guide the post-season audit.
Complete a Post-Season Audit and Update Next Year's Playbook
Once peak wraps up, run a structured post-season audit. Compare forecast vs. actual volume by process step - receiving, picking, and packing - instead of looking only at total headcount.
Document staffing gaps, no-show rates, and how well cross-training held up under pressure. If temp attrition ran high before a major holiday window, note when recruiting began and whether an earlier timeline would have helped.
Then update your shift templates, hiring timelines, and cross-training priorities using real numbers, so next year's plan starts from a stronger baseline.
Peak Season Playbook Strategies for Smooth Warehouses | E11
FAQs
How do I know when overtime is no longer enough during peak?
Overtime stops working during peak once demand pushes past your planned capacity and extra hours still don’t close the gap.
If overtime, added shifts, and real-time scheduling changes can’t keep up with volume anymore, your staffing strategy has hit its limit.
Which warehouse tasks should be cross-trained first before peak season?
Cross-train entry-level tasks first, such as:
- packing
- sorting
- label work
These jobs are simple to learn and often take just a few hours to pick up. That makes them a smart starting point for new hires or temporary staff during busy seasons.
By starting with simpler work, teams can get people into action faster and keep throughput steady.
Which shift KPIs matter most when demand changes midweek?
The most important shift KPIs are pick rate, order fulfillment rate, inventory accuracy, and schedule agility.
These numbers help teams react fast to midweek demand changes without losing productivity.
Related Blog Posts
Related Articles

3PL Compliance Study: Risk Points in Fulfillment

AI Fraud Detection in 3PL Logistics