Supply Chain Optimization Scorecard
Supply Chain Optimization Scorecard
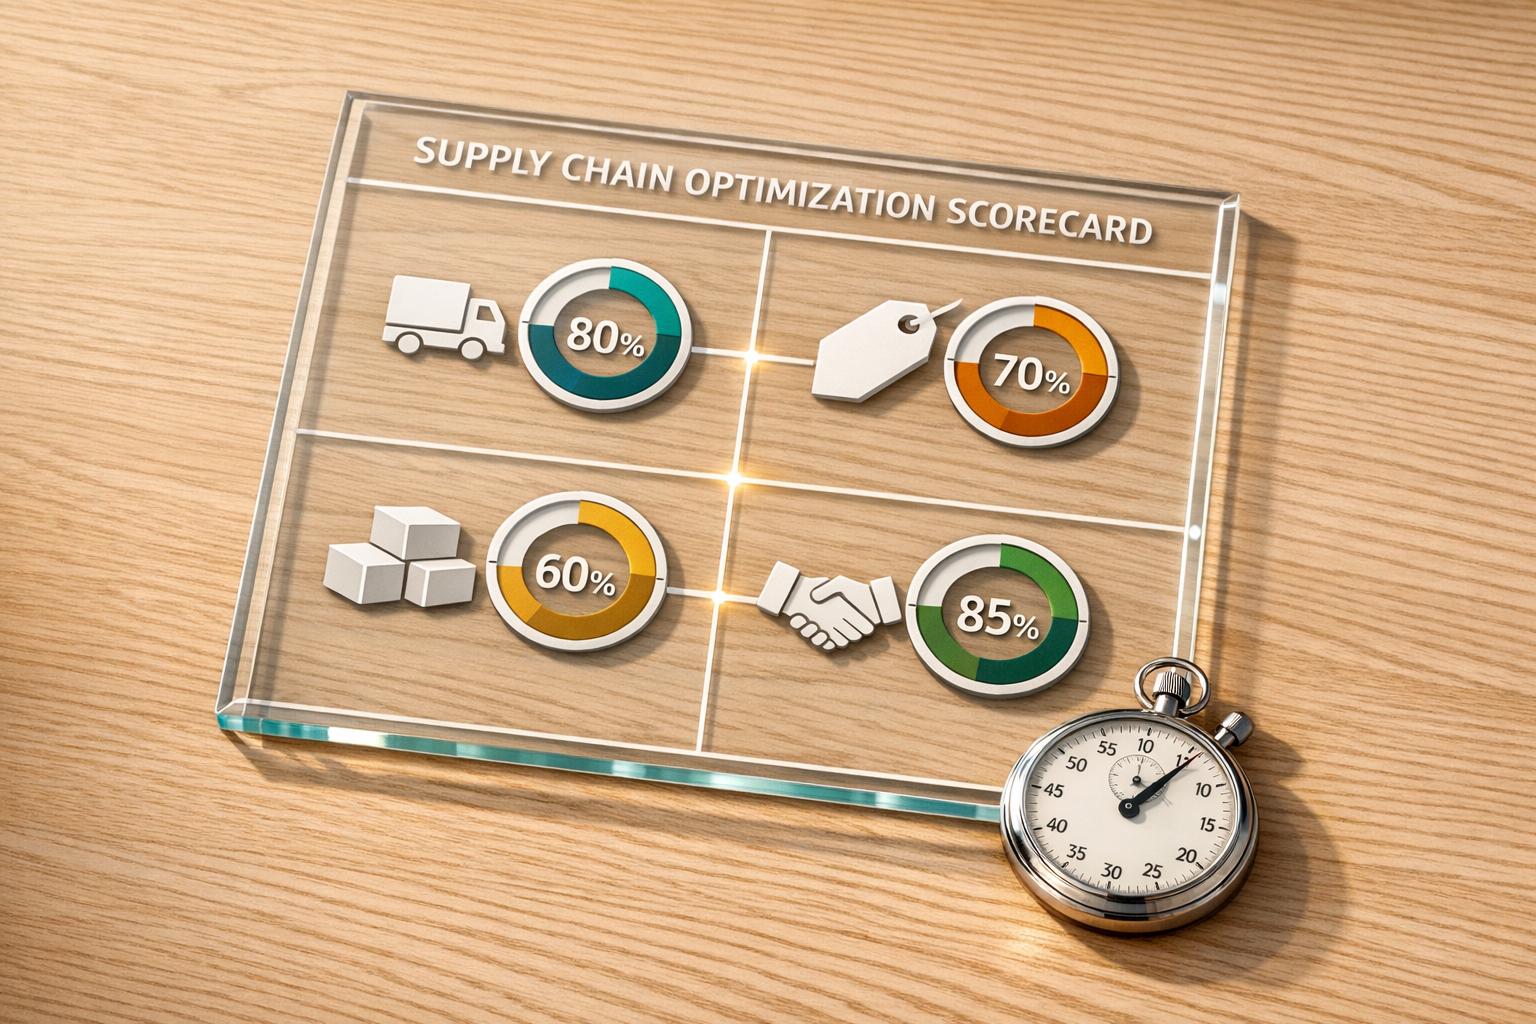
Get a clearer view of performance
A strong supply chain depends on more than fast shipping or low costs alone. This Supply Chain Optimization Scorecard helps you evaluate the balance between delivery speed, cost efficiency, inventory turnover, and supplier reliability in one simple view. Instead of digging through scattered reports, you can rate key areas, generate a weighted score, and quickly see where operational performance stands.
Why this scorecard is useful
For operations leaders, procurement teams, and logistics managers, a practical scoring tool can make benchmarking much easier. A weak supplier network, slow delivery performance, or poor inventory movement can quietly hurt margins and customer satisfaction. With this supply chain performance assessment tool, it's easier to identify those pressure points early.
Turn data into action
The score isn't just a label. It gives context. If your results show strong delivery but weak cost efficiency, you know where to look next. If inventory turnover lags behind expectations, that may point to excess stock or demand planning issues. Used regularly, a Supply Chain Optimization Scorecard can support better decisions, clearer reporting, and smarter conversations about where to improve first.
FAQs
How is the final supply chain score calculated?
The tool uses a weighted model so each metric contributes based on its importance. Delivery speed and cost efficiency each account for 30% of the score, while inventory turnover and supplier reliability each account for 20%. After normalizing the inputs, the tool calculates a final score out of 100 and assigns a performance category based on the result.
What happens if I don't know my inventory turnover rate?
If you leave inventory turnover blank, the tool can use a default industry-average value so you can still complete the assessment. That makes it useful for quick reviews, early benchmarking, or teams that don't have every KPI on hand. If you do know your turnover rate, entering the real number will give you a more accurate score.
What do the strength and weakness insights actually tell me?
The analysis looks at each individual input and flags areas that are likely helping or lowering your overall performance. For example, a strong delivery score may be recognized as a clear advantage, while a low cost efficiency rating might be identified as a drag on the final result. These comments are meant to give you an immediate starting point for discussion and improvement planning, not just a number without context.
Related Articles

Cross-Border Demand Forecasting: Guide For 3PL Teams

Forecast Models for Seasonal E-commerce Peaks