Supply Chain Performance Scorecard

Optimize Your Operations with a Supply Chain Performance Scorecard
Running a supply chain is a complex dance of logistics, timing, and costs. For managers looking to stay ahead, evaluating key performance indicators (KPIs) is essential. That’s where a tool to measure supply chain efficiency comes in handy. It offers a straightforward way to assess critical metrics and identify opportunities for growth.
Why Metrics Matter in Logistics
Every shipment, every order, every dollar counts when you’re managing inventory and deliveries. Tracking things like on-time delivery rates or inventory turnover isn’t just about numbers—it’s about understanding how well your operations align with customer expectations. A high delivery accuracy rate builds trust, while keeping freight expenses in check boosts your bottom line. But without a clear system to analyze these factors, it’s easy to miss the bigger picture. Using a dedicated evaluation tool can break down these insights into actionable steps, helping you refine processes one metric at a time.
Take Control of Your Performance
Whether you’re overseeing a small warehouse or a global network, staying on top of logistics health is non-negotiable. A quick analysis can reveal hidden inefficiencies and guide smarter decisions. Ready to see where you stand? Dive into our free resource and start improving today.
FAQs
What metrics does this scorecard evaluate?
Our tool looks at four key indicators: on-time delivery rate (as a percentage), order accuracy rate (also a percentage), inventory turnover (how many times your stock turns over yearly), and freight cost per order (in your chosen currency). These are weighted to give a balanced view—delivery and accuracy each count for 30%, while turnover and cost efficiency are 20% each. It’s a solid mix that reflects what matters most in supply chain management.
How is the performance score calculated?
We take your input for each metric and apply a weighted average to get your overall score. On-time delivery and order accuracy carry the most weight at 30% each, since they directly impact customer satisfaction. Inventory turnover and freight cost efficiency each contribute 20%. Once calculated, your score falls into a category: above 85 is 'Excellent,' 70-85 is 'Good,' and below 70 means 'Needs Improvement.' You’ll also get specific tips based on your results.
Can I use this tool for multiple assessments?
Absolutely! Once you’ve run an analysis, just hit the reset button to clear the fields and start fresh. It’s perfect for comparing different time periods, suppliers, or even facilities. There’s no limit to how many times you can use it, and since it’s free, you can keep tweaking and tracking without any hassle.
Related Articles

Ultimate Guide to IoT Sensors in Cold Chain Logistics
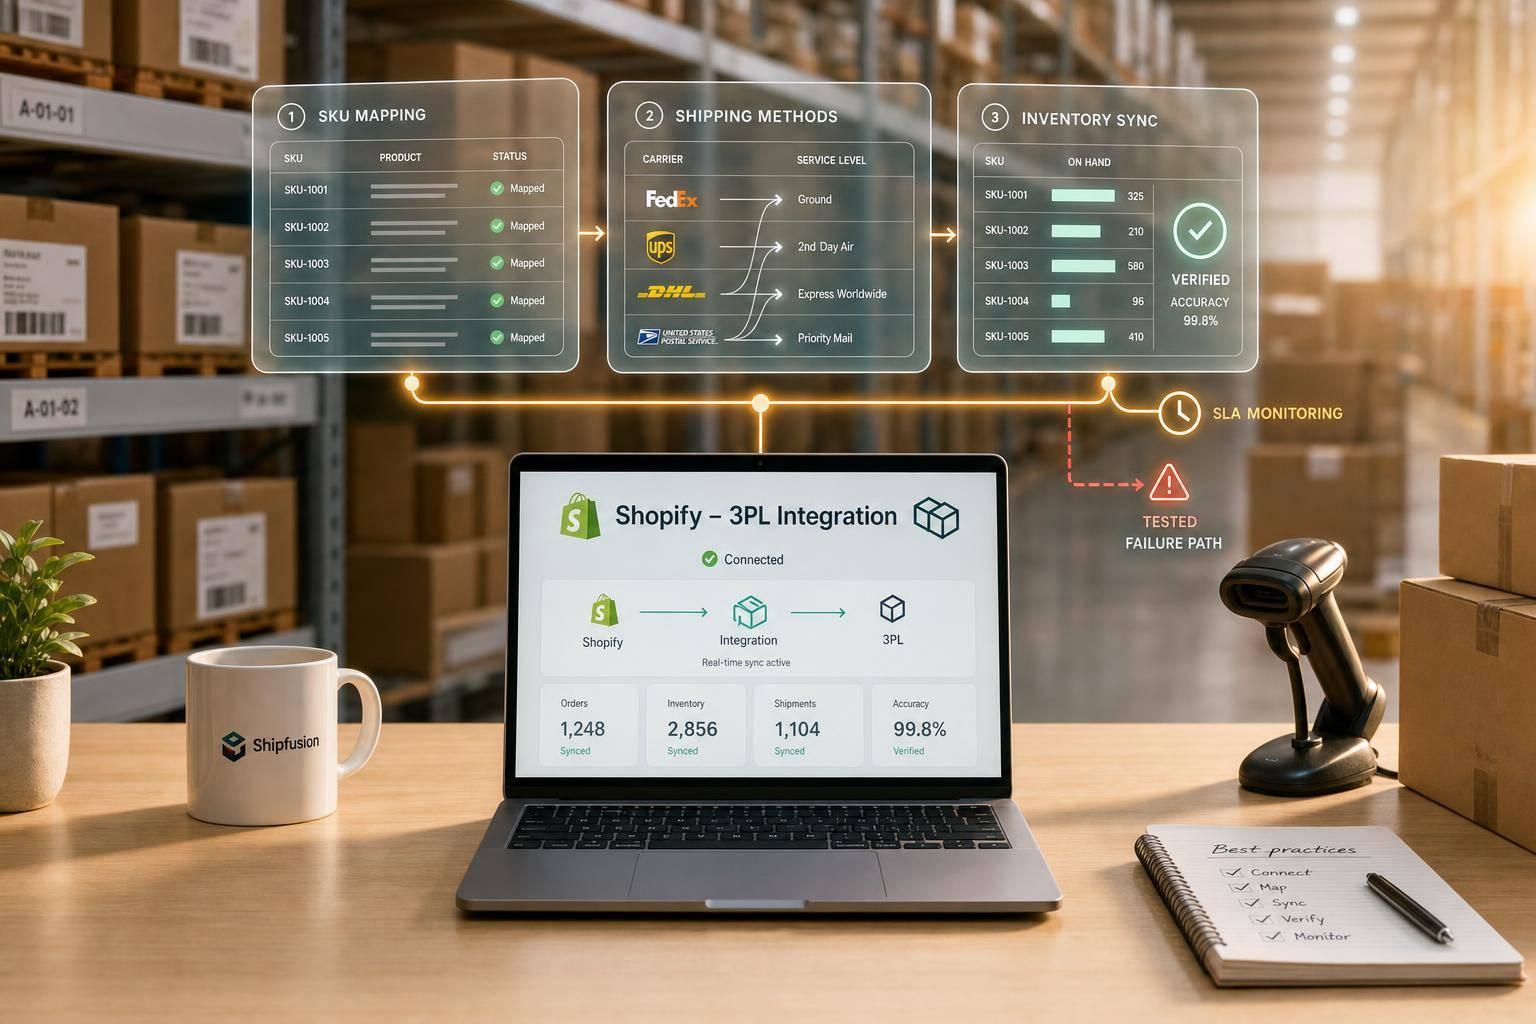
Shopify 3PL Integration: Best Practices