How to Track Reverse Logistics Metrics
Reverse logistics is all about managing products returned by customers - whether for refunds, repairs, recycling, or resale. Tracking the right metrics can help businesses improve efficiency, cut costs, and enhance customer satisfaction. Here’s a quick breakdown of the key metrics you should focus on:
- Return Rate: Percentage of products returned versus sold. High return rates may signal product quality or description issues.
- Cost of Returns Processing: Total expenses for handling returns, including shipping, labor, and refurbishment.
- Recovery Rate: Percentage of value recaptured through resale, repair, or recycling.
- Cycle Time for Returns: Time taken from return initiation to resolution. Shorter times improve cash flow and inventory management.
- Customer Satisfaction: Feedback on the returns experience, vital for maintaining customer loyalty.
What Unexpected Supply Chain Benefits Come From Reverse Logistics? - Smart Logistics Network
Key Reverse Logistics Metrics to Track
Understanding the fundamentals of reverse logistics is just the beginning. To truly improve your operations, you need to focus on the right performance metrics. These key indicators provide a clear picture of how well your reverse logistics processes are working and highlight areas for improvement.
Return Rate
Return rate measures the percentage of products customers send back compared to total sales. The formula is simple: divide the number of returns by the total sales, then multiply by 100. For example, a 10% return rate might indicate problems with product descriptions or sizing.
In 2022, the average return rate for U.S. retail was about 16.5%, with e-commerce categories often exceeding 20%. This metric can be an early warning sign of issues like product quality, unmet customer expectations, or inaccurate marketing.
Breaking the return rate down by product category or sales channel can uncover telling patterns. For instance, if certain items consistently have higher return rates, it might point to poor product quality or misleading descriptions. Similarly, comparing return rates across channels can help pinpoint problem areas.
Cost of Returns Processing
This metric accounts for all the costs involved in handling returns, including shipping, labor, refurbishment, and disposal. Labor alone often makes up around 40% of these expenses, highlighting the potential for automation or process changes.
In 2022, U.S. retailers lost over $816 billion in sales due to returns, not even factoring in the costs of processing and restocking. By understanding your specific processing costs, you can make smarter decisions about return policies and identify the main cost drivers in your operations.
Breaking down costs by product type can also be helpful. For example, electronics may require detailed refurbishment, while apparel might only need basic inspection. This approach helps allocate resources more effectively.
Recovery Rate
While costs are important, tracking how much value you recover from returns adds another layer to your strategy. The recovery rate measures the percentage of value reclaimed through resale, repair, or recycling. To calculate it, divide the recovered value by the total value of returned items, then multiply by 100. For instance, recovering $7,000 from $10,000 worth of returns gives you a 70% recovery rate.
Recovery rates vary widely - electronics and apparel can range from 30% to 70%, depending on how well items are refurbished or resold. Electronics companies, for example, often recover up to 70% of the value of returned devices by reselling them through secondary markets.
To maximize recovery rates, you need efficient processes and strong partnerships. Collaborating with refurbishment experts or discount retailers can reduce the financial impact of returns significantly.
Cycle Time for Returns
Cycle time measures how long it takes from when a customer initiates a return to when the item is either back in inventory or disposed of. This includes shipping, inspection, processing, and restocking. Top-performing companies complete this process in 3–5 days, while others might take 2–3 weeks.
Shorter cycle times improve inventory recovery and cash flow, while longer times often point to inefficiencies in staffing, inspections, or shipping. Monitoring cycle times by return type or season - such as during holiday peaks or for electronics requiring extra testing - can help you set realistic goals and allocate resources effectively.
Customer Satisfaction with Returns
Customer satisfaction measures how users feel about their overall returns experience. This can be gauged through post-return surveys, Net Promoter Scores (NPS), or other feedback tools. High satisfaction scores often reflect a smooth, hassle-free process that builds customer loyalty.
Key factors affecting satisfaction include how easy it is to initiate returns, clear communication about the return status, prompt refunds or exchanges, and an overall seamless experience.
Gathering feedback at multiple stages - during the return request, after shipping, and once the issue is resolved - can spotlight pain points and track progress over time. A positive returns experience can turn a frustrating process into an opportunity to strengthen customer relationships.
| Metric | What It Measures | Typical Range | Key Benefit |
|---|---|---|---|
| Return Rate | Percentage of products returned versus sold | 10–25% | Identifies potential quality issues |
| Cost of Returns Processing | Total expenses for handling returns | Varies by product type | Reveals areas to cut costs |
| Recovery Rate | Percentage of value recovered from returns | 30–70% | Directly impacts profitability |
| Cycle Time for Returns | Time from return initiation to resolution | 3–21 days | Improves cash flow and efficiency |
| Customer Satisfaction | Feedback scores on the returns experience | Target 80%+ | Builds customer loyalty |
Next, discover how to analyze these metrics effectively to create a more efficient and customer-friendly reverse logistics system.
How to Track and Analyze Reverse Logistics Metrics
Collecting data on returns is just the beginning. The real value lies in turning that data into actionable insights that can drive meaningful changes. Here's how you can develop a structured approach to tracking and analyzing your returns data.
Set Baseline Metrics
Before you can make improvements, you need to know where you currently stand. Establishing baseline metrics provides a clear snapshot of your starting point and helps you set achievable goals.
Start by gathering 12 months of historical data. Record your return volume and calculate the return rate. Track how long it takes to process returns, from the moment a customer initiates the return to when the item is back in inventory or ready for its next step. Don’t forget to include total return costs - this should cover goods sold, shipping, processing, return fees, and disposition costs - minus any resale value. Also, document error rates and the condition of returned products.
For example, your baseline might show that you handle 500 returns per week, which represents about 6% of your total sales, with an average processing time of 8 days and a cost of $18 per return. These benchmarks will help you measure progress over time. To ease the transition to a new tracking system, focus on metrics in phases. Start with basics like return volume and return rate in the first few weeks, then layer in cost metrics, cycle time measurements, and advanced insights like recovery rates and customer satisfaction scores over the following months.
Once you’ve established your baselines, automate data collection to simplify ongoing analysis.
Use Technology for Data Collection
As your business expands, manually collecting data becomes less practical. Automation can save time and improve accuracy.
Invest in warehouse management systems or logistics software that integrates data from different sources, such as warehouses, transportation networks, and customer feedback systems. Look for tools that include automated return merchandise authorization (RMA) tracking, which monitors items from the moment they leave a customer’s hands to their final resolution. Features like real-time dashboards, automated reporting, and omnichannel tracking across retail, e-commerce, and wholesale channels are especially useful. Tagging and tracing tools can also help you monitor specific processes.
A strong platform can identify trends like high-frequency returns for certain items or recurring reason codes. For example, a major U.S. electronics retailer that adopted an automated returns management system in 2022 was able to cut its average processing time from 7 days to just 2 days. The system also boosted its recovery rate by 15% and reduced processing costs by 20%.
Find Trends and Root Causes
Raw data tells you what’s happening, but digging deeper into trends and root causes helps you understand why it’s happening - and what you can do about it.
Use automated tools to analyze trends and identify operational gaps. Look for patterns across different dimensions:
- Return reasons by product: Spot common defects or quality issues. For example, if a specific SKU has a higher-than-average return rate, check for problems like inaccurate product descriptions, quality issues, or mismatched customer expectations.
- Returns by channel: Track seasonal spikes or patterns tied to product launches or marketing campaigns.
- Repeat returns: Identify recurring issues that might point to systemic problems.
One apparel company reduced returns related to sizing issues by 12% in just six months after revising its product descriptions.
Once you’ve identified patterns, take targeted steps to address them. For high-return products, improve quality control. For items with frequent “item not as described” returns, enhance product descriptions and photos, or include user-generated reviews to set better customer expectations. For instance, if 35% of returns for a product are due to inaccurate descriptions, the issue might lie in marketing rather than the product itself. Collaborate across teams - product, marketing, operations, and customer service - to dig deeper, document findings, implement solutions, and monitor the results.
sbb-itb-eafa320
How JIT Transportation Helps with Reverse Logistics

Understanding when to outsource reverse logistics can save time, money, and resources. By analyzing key metrics, businesses can determine whether outsourcing returns is more efficient than managing them in-house.
In the U.S., e-commerce return rates hover around 20%, which can overwhelm internal systems and make outsourcing a smarter choice. Rather than investing in costly infrastructure to handle this volume, partnering with a specialized third-party logistics (3PL) provider like JIT Transportation can simplify operations and improve performance.
JIT Transportation offers scalable solutions, value-added services, and real-time analytics to help businesses manage returns effectively.
Scalable Returns Management Solutions
E-commerce businesses often face fluctuating return volumes, with rates ranging from 15-30% depending on the product category. Managing these returns internally can lead to increased operational costs, especially during peak seasons.
JIT Transportation addresses this challenge with a nationwide, flexible infrastructure that adapts to changing demands. Instead of expanding warehouse space or hiring seasonal staff, businesses can use JIT's distributed network to process returns closer to customers. This approach cuts both processing times and shipping costs while avoiding long-term investments in fixed assets.
For seasonal businesses or companies experiencing rapid growth, this scalability is a game-changer. Automating reverse logistics can reduce processing times by up to 50% and lower costs by 20-30%. By outsourcing to JIT, businesses maintain high service standards without the stress of managing fluctuating return volumes.
Enhanced Reverse Logistics with Value-Added Services
JIT Transportation goes beyond basic returns processing by offering services that directly improve recovery rates - the percentage of returned items that can be resold, refurbished, or recycled. These services include testing, kitting, assembly, and white glove handling.
Testing services ensure quick evaluation of a product's condition to determine the best course of action, whether it's repair, refurbishment, or recycling. For instance, an electronic device might only require a software update or minor repair, allowing it to be resold faster. By handling these processes internally, JIT minimizes the time it takes for returns to re-enter the market.
White glove handling is another key service, particularly for fragile, high-value, or luxury items. Careful handling ensures that returned products remain in resalable condition, reducing damage and boosting customer satisfaction. This level of attention reassures customers that their returns are treated with care, enhancing their overall experience.
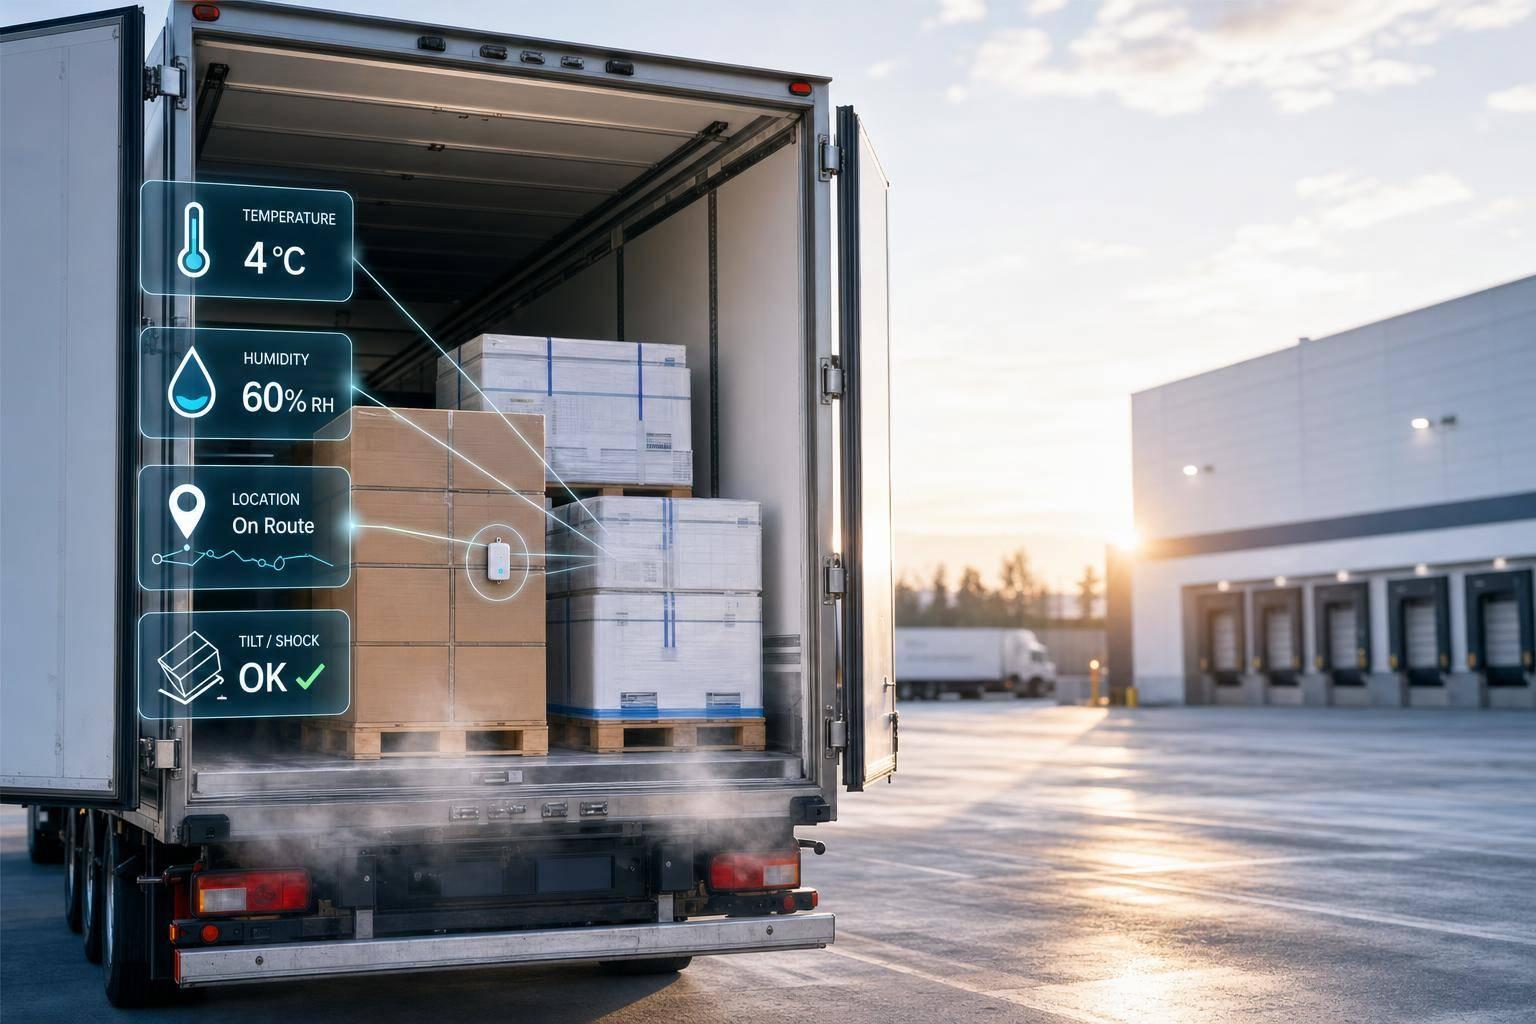
Real-Time Tracking and Analytics
JIT Transportation’s advanced technology turns returns into opportunities for profit optimization. Their system captures detailed data across all return channels - whether retail, e-commerce, wholesale, or B2B - offering a complete view of performance.
Real-time analytics allow businesses to monitor operations constantly. For example, if the average return processing time is five days, the system flags any delays, enabling teams to address issues quickly. This proactive approach helps maintain efficiency and prevents bottlenecks.
Additionally, JIT’s technology provides insights tailored to specific sales channels. Each channel - whether e-commerce or retail - has unique return patterns and costs. E-commerce returns might involve higher shipping expenses but require less labor, while retail returns could offer immediate restocking and resale opportunities. By segmenting data, businesses can identify areas for improvement and focus on the most profitable channels. These insights ensure continuous process refinement and smarter decision-making.
Key Takeaways
Tracking reverse logistics metrics can turn returns into a strategic advantage. Companies have reported up to a 30% reduction in return-related expenses by focusing on the right metrics and acting on the insights they provide.
Most Important Reverse Logistics Metrics
There are five key metrics to monitor: return rate, returns processing cost, recovery rate, cycle time, and customer satisfaction.
- Return rate highlights product quality issues and identifies problem areas. When broken down by product or sales channel, it can reveal mismatches in product descriptions, quality control, or marketing efforts.
- Returns processing cost measures the expenses involved in handling returns, while recovery rate tracks the value recaptured through resale, refurbishment, or recycling.
- Cycle time for returns - the duration from when a customer initiates a return to its resolution - directly influences customer satisfaction. Faster processing often leads to higher satisfaction and greater customer loyalty.
These metrics offer actionable insights to refine processes and achieve tangible improvements.
Next Steps for Your Business
Start by setting KPIs that align with your business objectives. Use historical data to establish benchmarks. Implement returns management systems featuring real-time reporting to automate data collection and analysis. These tools not only reduce manual tracking but also quickly identify bottlenecks and cost drivers.
To take your reverse logistics strategy further, consider partnering with experienced third-party logistics (3PL) providers like JIT Transportation. Their specialized expertise and infrastructure can make a significant difference. As Ron Okamoto from Nippon Express USA explains:
"JIT isn't just another trucking company - they are true logistics innovators. Their ability to anticipate industry shifts, build long-term relationships, and deliver tailored, high-impact solutions sets them apart as a leader in the field. We trust JIT to move our business forward."
FAQs
How can businesses track reverse logistics metrics to lower costs and enhance customer satisfaction?
To keep a close eye on reverse logistics performance, businesses should prioritize tracking key performance indicators (KPIs) such as return rates, processing time, recovery value, and customer feedback. Start by identifying which metrics align best with your operations and set clear, measurable goals to drive improvement.
Leverage technology to monitor these KPIs in real-time. This allows you to quickly identify inefficiencies and spot trends. For instance, keeping tabs on return processing times can help minimize delays, while analyzing recovery value can uncover opportunities to save costs. Regularly reviewing and fine-tuning these metrics can help businesses streamline their reverse logistics, trim unnecessary expenses, and enhance the customer experience.
What are the best tools or technologies for automating the tracking of reverse logistics metrics?
To make tracking reverse logistics metrics more efficient, businesses can use tools like data analytics platforms, inventory management systems, and specialized logistics software. These technologies automate data collection, enable real-time tracking of returns, and provide insights to fine-tune your reverse logistics process.
For instance, advanced logistics software can seamlessly connect with your supply chain systems to track key metrics like return rates, processing times, and cost efficiency. On top of that, technologies such as RFID tags, barcode scanners, and IoT sensors can boost accuracy and cut down on manual work when managing returned items. Adopting these tools offers better visibility and control over your reverse logistics workflow.
What are the benefits of outsourcing reverse logistics to a provider like JIT Transportation compared to managing it in-house?
Outsourcing reverse logistics to a provider like JIT Transportation comes with a host of benefits compared to managing it in-house. Third-party providers bring specialized knowledge, advanced tools, and scalable systems that can simplify the returns process, cut down on costs, and enhance supply chain performance.
With JIT Transportation's extensive nationwide network and customized 3PL services, businesses can stay focused on their primary operations while ensuring returns are handled swiftly and reliably. On top of that, outsourcing opens the door to additional services like kitting, assembly, and white-glove handling - tasks that can be tough to manage internally.
Related Blog Posts
Related Articles
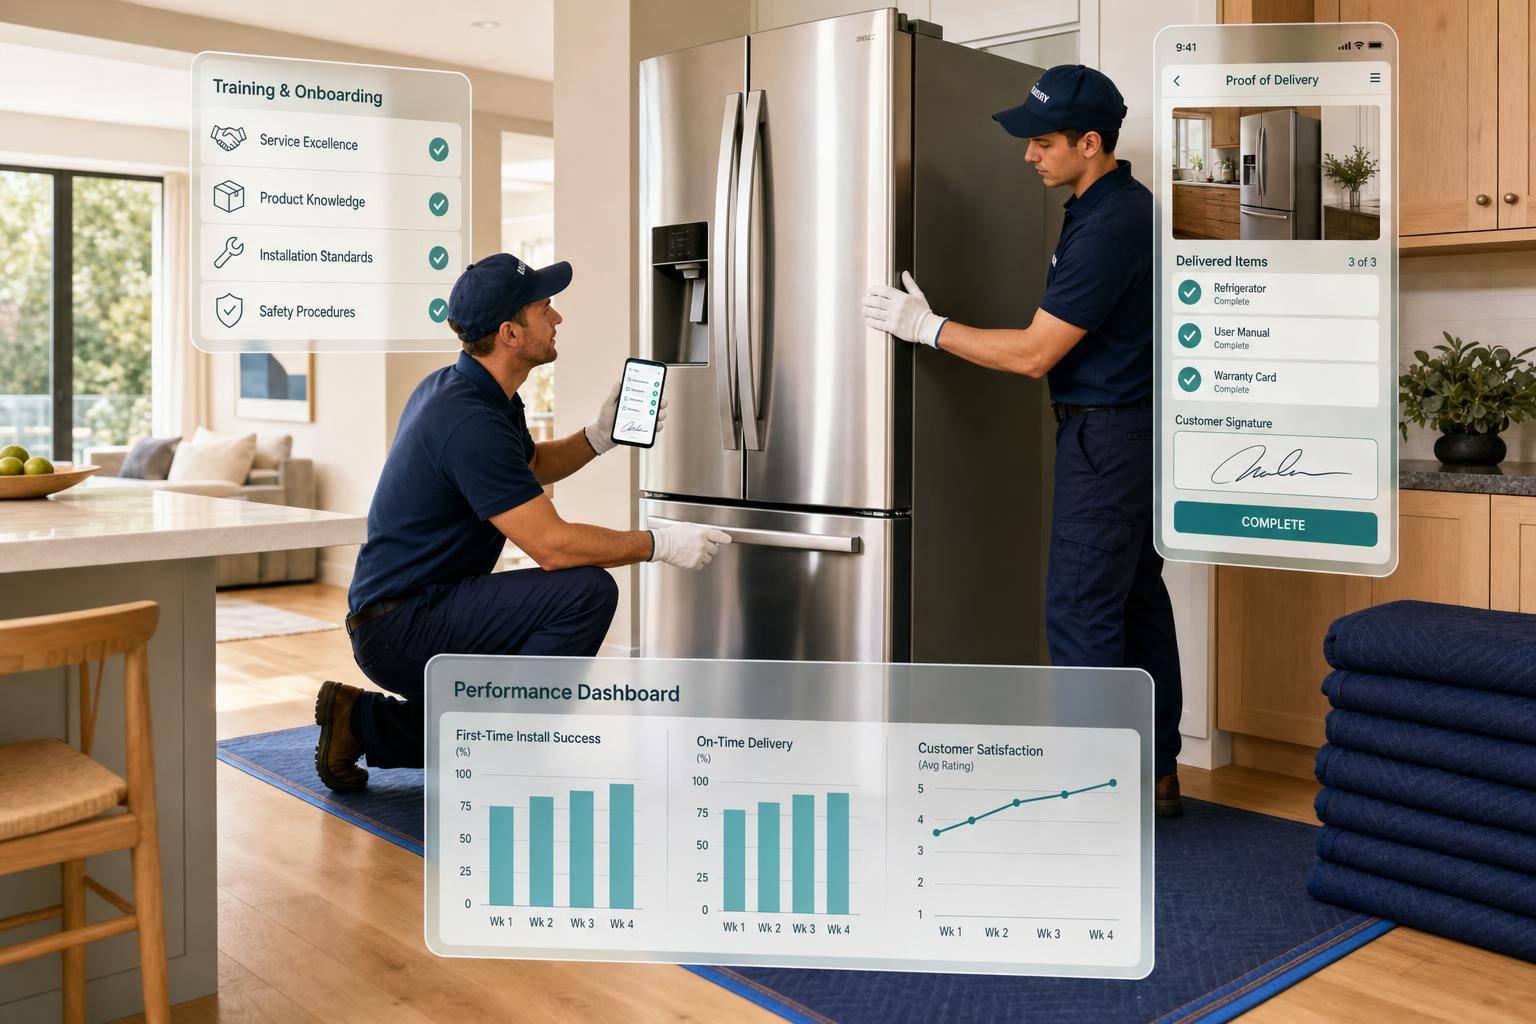
How 3PLs Train White Glove Delivery Teams
Ultimate Guide to Automation Change Management