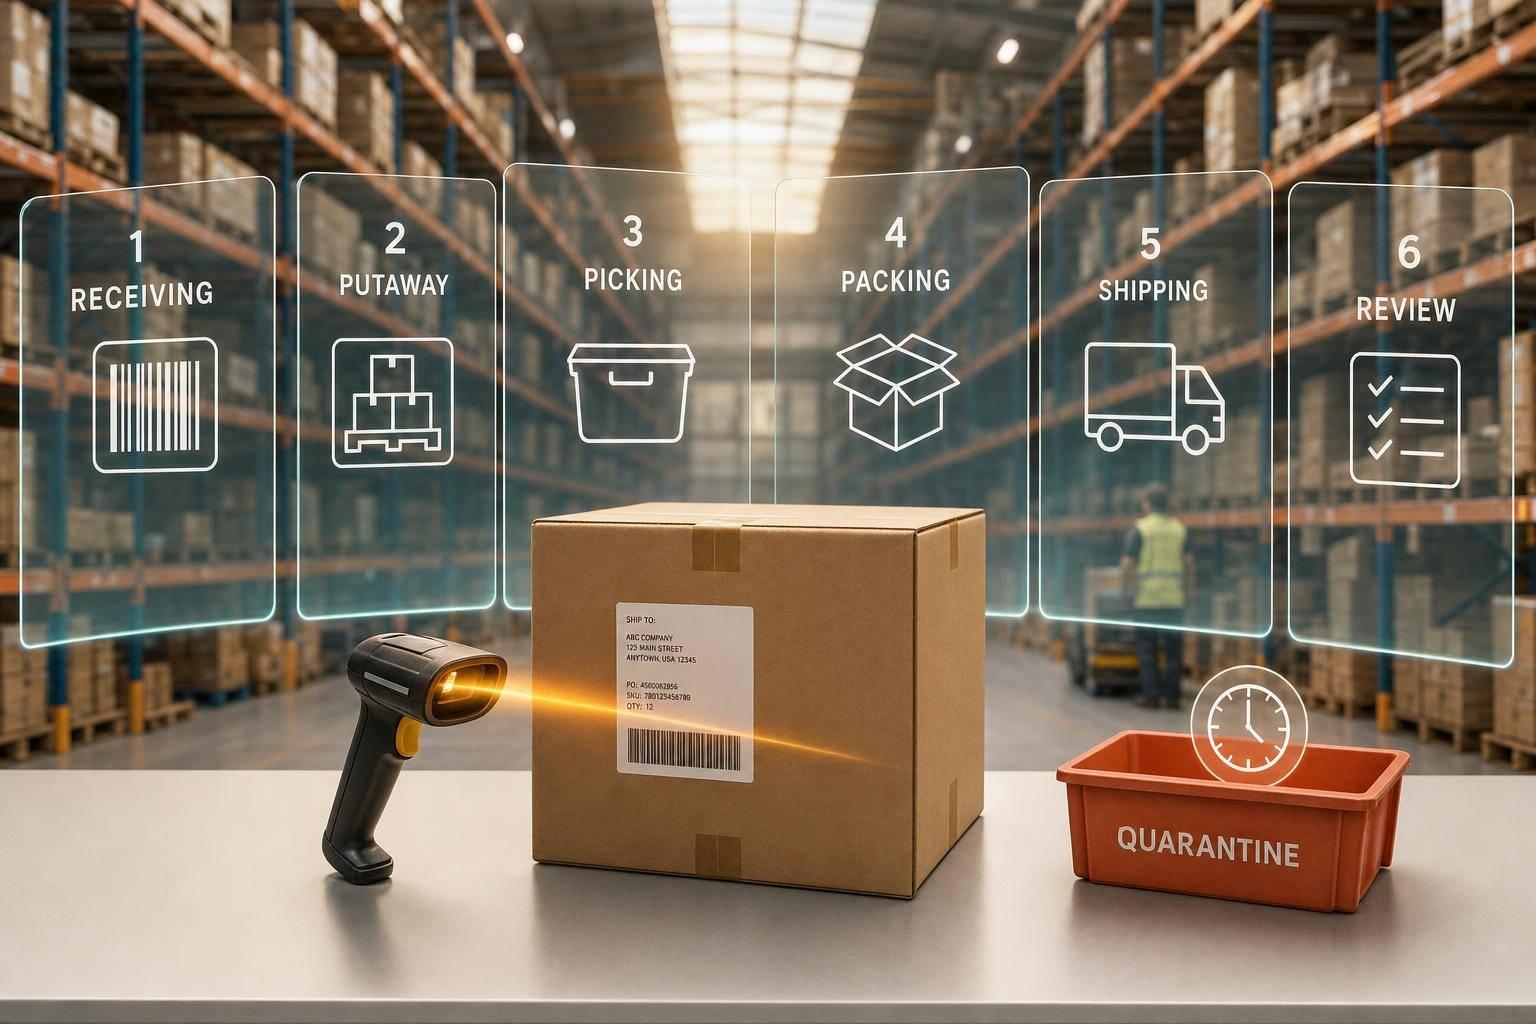
Carbon-Neutral Shipping Tools: 9 Options for 3PLs
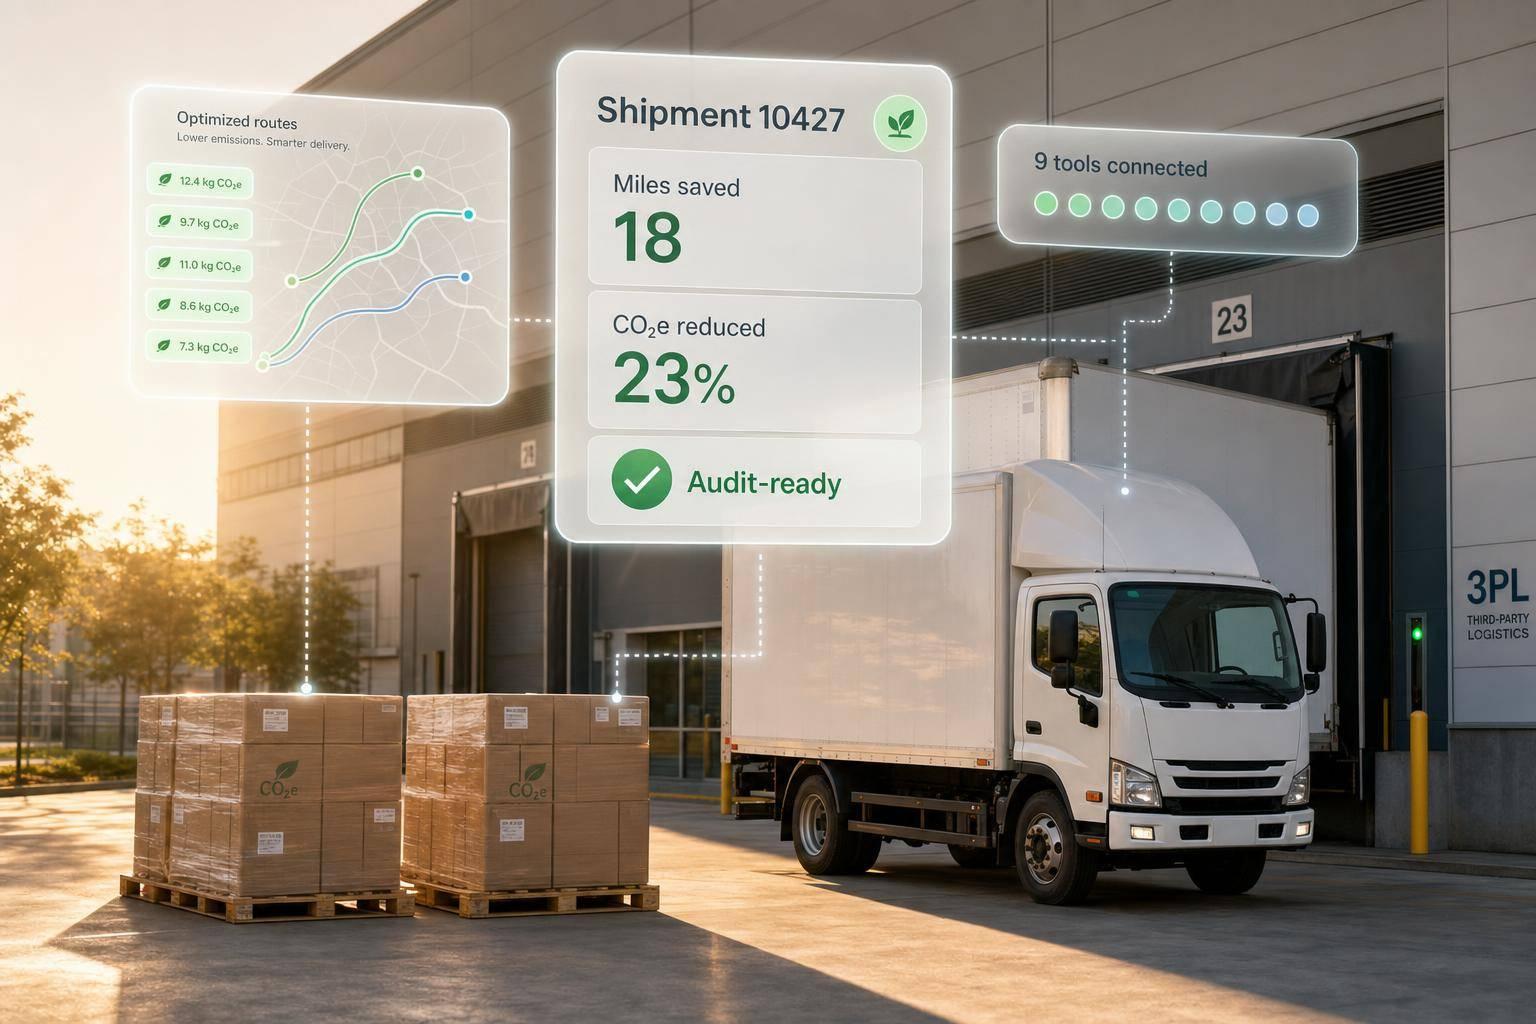
Freight moves about 8% of global greenhouse gas emissions, and for 3PLs, the fix starts with better shipment data. If I had to sum up the article in one line, it’s this: the right tool stack helps me measure CO2e at the shipment level, cut miles and fuel use, and turn that data into client-ready reports.
Here’s the short version:
- I need shipment-level CO2e, not rough averages, because bad inputs can skew numbers by 30% to 50%
- I should look for tools that follow GLEC Framework v3.0 and ISO 14083
- The biggest cuts often come from mode shift, routing, load planning, consolidation, and network design
- Good tools must connect with WMS, TMS, ERP, EDI, APIs, and telematics
- The nine categories cover the full cycle: measure, cut, audit, and report
The nine options are:
- JIT Transportation integrated 3PL workflows
- Logistics emissions calculators
- TMS with carbon visibility
- Parcel audit and billing intelligence tools
- Route optimization and network design software
- Carrier sustainability scorecards
- Carbon reporting dashboards
- Returns optimization platforms
- Packaging optimization and cartonization tools
What stands out most is simple: these tools do different jobs. Some measure emissions. Some help me cut miles. Some clean up billing data. Some turn all of that into ESG reporting by client, lane, or shipment.
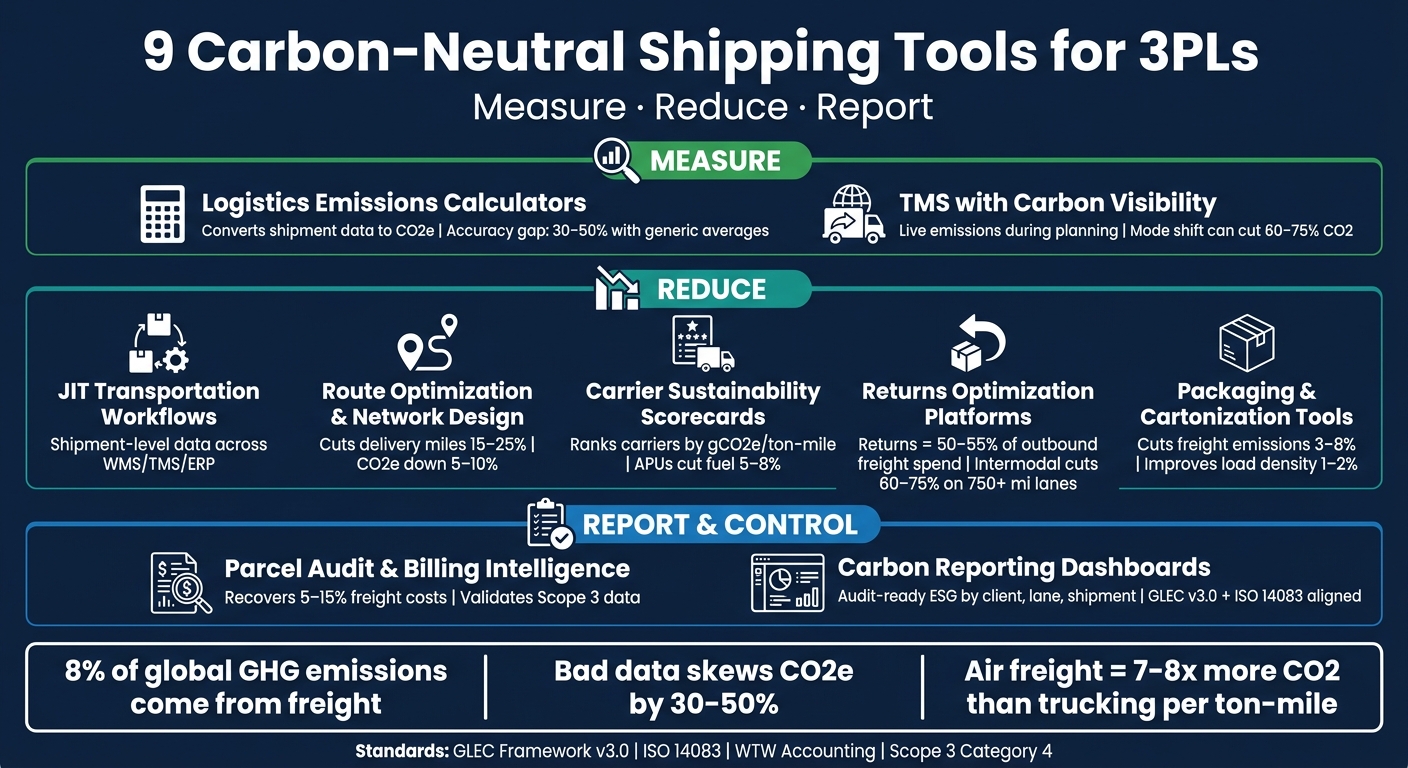
9 Carbon-Neutral Shipping Tools for 3PLs: Measure, Reduce & Report
Quick Comparison
| Tool category | Main job | What I’d check first |
|---|---|---|
| JIT Transportation workflows | Connect shipment data across systems | Shipment-level data flow, client allocation, multi-leg tracking |
| Emissions calculators | Turn shipment data into CO2e | Carrier fuel data, vehicle type, WTW logic |
| TMS with carbon visibility | Show emissions during planning | Mode comparison, fuel support, telematics links |
| Parcel audit tools | Verify billed vs. moved shipments | Invoice detail, lane data, ERP/accounting links |
| Route/network software | Cut miles across delivery and facility layout | Re-routing, backhaul logic, multi-node support |
| Carrier scorecards | Rank carriers by emissions, cost, and service | Primary fuel/GPS data, score method, RFP use |
| Reporting dashboards | Build audit-ready carbon reports | Lane views, client splits, API/EDI links |
| Returns platforms | Cut miles and emissions on reverse logistics | Nearest-node routing, load grouping, shipment-level CO2e |
| Packaging/cartonization tools | Cut DIM weight and package waste | SKU dimensions, box logic, carrier API links |
If I’m picking where to start, I’d match the tool to the main gap in my network: long-haul lanes need mode shift tools, dense delivery networks need routing help, and enterprise client reporting needs audit-ready dashboards first.
sbb-itb-eafa320
What 3PLs Should Look for in Carbon-Neutral Shipping Tools
Use these filters to separate tools that only report emissions from tools that actually help cut them.
3PLs should put shipment-level numbers at the top of the list. If a tool leans on broad industry averages instead of carrier fuel data and vehicle-specific data, CO2 math can be off by 30–50%. That’s not a rounding error. It’s the kind of gap that can wreck reporting and make customer-facing claims hard to back up.
Shipment-level accuracy is the base layer. A solid tool uses the actual vehicle type for each move - like a reefer, van, or tractor-trailer - and pairs that with route distance from GPS or telematics. This matters even more in cold chain work. Refrigeration units add a 10–25% fuel penalty, and generic tools often miss it. When that happens, cold chain emissions look lower than they are.
Mode coverage matters just as much. If a 3PL handles truckload, LTL, parcel, intermodal, and ocean freight, using separate tools or patchy mode logic is asking for trouble. Emissions change a lot by mode. Air freight, for example, creates 7–8 times more CO2 than trucking per ton-mile. So if even a small share of air shipments gets tagged the wrong way, totals can drift fast. It helps to look for tools that line up with GLEC Framework v3.0 and ISO 14083, since those are the main standards for auditable Scope 3 transport emissions.
Integration also needs a hard look. API-first tools with EDI support make life much easier because data can move straight from your WMS, TMS, or ERP without manual exports. Webhooks help too, especially when teams need real-time updates across fulfillment workflows. Put simply: if the tool needs a lot of spreadsheet babysitting, it’s probably going to slow people down.
The reporting layer should work for both ops teams and customers. Ops teams need lane-level benchmarking in gCO2e/tkm so they can spot high-emission corridors and dig into what’s driving them. Customers need audit-ready ESG reporting by account, shipment, or order. And white-label dashboards can cut out a lot of spreadsheet work that no one wants to do in the first place.
Then comes the workflow layer, where emissions get reduced before they ever show up in a report.
1. JIT Transportation Integrated 3PL Workflows
JIT Transportation acts as the workflow layer that turns measurement needs into automated, shipment-level carbon data. It links shipment data with WMS, TMS, and ERP systems, which cuts manual entry and keeps carbon data attached to each load.
It calculates shipment-level CO2e using carrier, vehicle, fuel, and route data aligned with GLEC Framework v3.0 and ISO 14083.
For multi-node operations, it tracks emissions from the distribution center to the hub to the final delivery. That includes temperature-controlled shipments, too.
It also automates multi-client carbon allocation by account, lane, or shipment, which makes client reporting much easier. On top of that, lane-level benchmarking shows which corridors produce more emissions. So this workflow supports reporting in a practical way, not measurement alone.
2. Logistics Emissions Calculators
The workflow layer gathers shipment data. The emissions calculator turns that data into usable CO2e.
Put simply, a logistics emissions calculator takes shipment details and converts them into emissions figures using inputs like carrier fuel data, route distance, vehicle type, and fuel type.
Input quality makes a huge difference. If the calculator leans on generic industry averages instead of carrier-specific fuel and GPS data, CO2e numbers can be off by 30% to 50%. And reefer shipments can’t be treated like standard dry van moves. They need their own calculation because refrigeration adds a 10% to 25% fuel penalty.
For reporting, the calculator should line up with GLEC Framework v3.0 and ISO 14083. It should also use Well-to-Wheel (WTW), not only Tank-to-Wheel (TTW). That matters because WTW looks at the full fuel lifecycle, from extraction and refining to combustion. Without that, comparing diesel to options like HVO or electric can get misleading fast.
On the system side, many calculators connect through API or EDI to TMS, WMS, and ERP platforms. That lets shipment data move in automatically instead of being entered by hand. In multi-node workflows, each leg should be calculated on its own and then rolled up to the freight-order total. From there, the data can guide carrier, route, and mode choices inside the TMS layer.
3. Transportation Management Systems with Carbon Visibility
A carbon-aware TMS treats CO2e as a live planning signal, not something you look at after the load is booked. That means planners can compare road, intermodal, cost, transit time, and emissions side by side before they make a choice. If a long-haul truck lane moves to intermodal rail, emissions can drop by 60% to 75%. You only see that tradeoff in time to act on it when the TMS puts emissions directly into the planning flow. In that setup, the TMS becomes the decision layer, not just the reporting layer.
Once emissions show up in planning, the next step is audit-ready reporting. For that, the system should align with GLEC Framework v3.0 and ISO 14083, use Well-to-Wheel (WTW) accounting, and support CSRD, ESRS E1, and Scope 3, Category 4 reporting. It should also handle more than one fuel type, including diesel, HVO, LNG, CNG, biodiesel blends, and electric, with vehicle-specific modifiers for equipment such as reefers or vans.
Integration matters just as much. When the TMS connects with WMS and ERP systems, emissions data can roll back to specific orders, pallets, or product lines. That makes the numbers more useful for planning, finance, and reporting. Ties to carrier GPS and telematics also matter because they swap modeled estimates for telematics-backed data, which gives planners a much firmer base for shipment decisions. For LTL and shared loads, use weight- or volume-based allocation so emissions are split cleanly across shipments.
Accuracy comes down to current inputs, not fixed ones sitting in the system for months. Check that the emission factor library is updated quarterly.
4. Parcel Audit and Billing Intelligence Tools
Once planning and calculation are done, parcel audit tools answer a simple question: What actually got billed and moved? They check invoices, catch errors, and turn billing records into shipment-level carbon inputs. Companies that automate freight audit and rate checks often see 5% to 15% lower freight costs.
That matters because freight payment records usually contain the same core fields used to check Scope 3, Category 4 emissions: mode, origin, destination, weight, and distance. In plain English, your billing data can do double duty. It helps confirm shipment-level CO2e numbers and supports client allocation.
The carbon story often shows up in patterns, not single invoices. When you look at billing data in the aggregate, you can spot lanes and carriers that keep triggering premium service fees or avoidable last-mile charges. Recurring accessorial fees, like redelivery charges or residential surcharges, are often a sign that the last mile isn't running as cleanly or cheaply as it could. That drives up both cost per order and the carbon load tied to final delivery.
It also helps to track the gap between calculated emissions and carrier-reported emissions. That gap can help calibrate emission factors and surface carrier performance problems. API and EDI connections to ERP and accounting systems keep the audit trail in place and send lane-level carbon data into client reporting. Those same lane-level records can then support route optimization decisions.
5. Route Optimization and Network Design Software
Route optimization and network design software cut extra miles across your fulfillment network, which also cuts the emissions tied to those miles. You get the best results when routing decisions and network design work in sync.
Here’s the simple difference: route optimization trims miles on each delivery run, while network design changes where facilities sit so freight travels fewer miles across the whole network. For distributed e-commerce inventory, network design is basically a warehouse placement choice. Moving from one fulfillment center to a two-facility setup can cut total transportation miles by 20–30%.
The gains can add up fast. Route optimization cuts delivery miles by 15% to 25% and CO2e by 5% to 10%. Network design can cut transportation miles by 20% to 30% and total emissions by 5% to 15%. And those gains matter even more when route plans can change as conditions change.
Instead of setting routes overnight and hoping nothing shifts by morning, today’s software uses real-time re-optimization as new orders come in or traffic, weather, or carrier availability changes. In plain terms, the plan keeps moving with the day. That same approach can also spot empty return miles and backhaul options, which cut both cost and emissions.
For reporting, leading tools line up with GLEC Framework v3.0 and ISO 14083. They use WTW accounting for auditable, per-shipment reporting.
For 3PLs running multi-node fulfillment, software also has to connect through API to WMS and ERP systems. That connection helps cover multi-leg road, rail, and ocean shipments while applying the right emission factors and allocation logic at each stage. Those outputs then feed the carrier scorecards and carbon dashboards that come next.
6. Carrier Sustainability Scorecards
Once routes are set, scorecards help 3PLs see which carriers move freight with the lowest emissions. They offer a simple way to rank carriers across emissions, cost, and transit time.
A good starting point is to track gCO2e per ton-mile. From there, rank carriers based on factors like:
- fuel mix
- empty-mile share
- load factor
- fleet age
- APU use
APUs can cut fuel use and emissions by 5% to 8%.
When pulling the data together, use primary fuel and GPS data first, modeled data second, and industry defaults last. For North American 3PLs, EPA SmartWay gives you a solid baseline for carrier ranking. Those rankings can then feed straight into procurement and reporting.
For compliance, scorecards should line up with GLEC Framework v3.0 and ISO 14083. Both require Well-to-Wheel (WTW) accounting. That matters when clients have disclosure duties. It also means scorecard data should show up in RFPs, so emissions carry weight alongside price and service. The same data can then flow into the carbon reporting dashboards in the next section.
7. Carbon Reporting Dashboards
Carrier scorecard data needs a reporting layer. That’s where carbon dashboards come in.
These tools pull emissions data from across your operation and turn it into structured, auditable reports. For 3PLs juggling many clients and warehouse nodes, that kind of visibility cuts down on spreadsheet-heavy reporting. Instead of digging through raw carrier files, teams get account-level reporting they can actually work with.
A strong dashboard tracks per-shipment CO2e, lane-level emission intensity (gCO2e/tkm), and carrier-specific inputs like vehicle type, fuel type, and Euro emission standards. It also needs to cover every tier of the network, from central distribution centers to regional hubs and customer-site, DC, and hub-level attributions. If that multi-node view is missing, audit-ready reporting can end up with blind spots.
Without carrier fuel and vehicle data, emissions estimates can miss by 30–50%.
That gap matters a lot more now because CSRD, SECR, and ESRS E1 are turning Scope 3 transport emissions into a reporting requirement, not just a nice extra. Dashboards that line up with GLEC Framework v3.0 and ISO 14083 use Well-to-Wheel accounting, which includes the full fuel lifecycle instead of only tailpipe emissions.
On the integration side, the best dashboards connect by API or EDI with your WMS, TMS, ERP, and carrier telematics systems. They also automate multi-client emission allocation, splitting emissions by client, lane, and carrier across hundreds of accounts without manual work. White-label dashboards can also support client-facing ESG reports, while helping teams spot emissions hotspots in returns and packaging.
8. Returns Optimization Platforms
Once dashboards show where returns are piling up, optimization tools handle the hard part: the trip back. These platforms send products to the nearest recovery node, group loads together, and move long-haul returns to lower-emission transport options. Return handling can account for 50% to 55% of outbound freight spend, and returns can carry a similar carbon load.
For many teams, network design is the biggest lever. Platforms with multi-node routing send returns to the nearest best processing site instead of pushing everything to one central hub. That matters a lot on long lanes. For trips over 750 miles, moving freight from over-the-road trucking to intermodal truck-to-rail can cut emissions by 60% to 75% per lane. And when partial loads are grouped into full truckloads, fewer vehicles hit the road, which cuts both cost and emissions. It also gives you cleaner carbon accounting for each return shipment.
Good platforms also calculate shipment-level CO2e using vehicle type, fuel type, and actual route distance. That detail matters. If you rely on default values instead of real carrier data, emissions can be off by 30% to 50%. The fix is pretty simple: use the same shipment-level CO2e method you use for outbound freight, so returns stay auditable.
What makes these tools useful for 3PLs is integration. API-first setups connect returns platforms with WMS, TMS, and ERP systems. That makes automated label creation, carrier tendering, and real-time carbon dashboards possible, with the ability to drill down from total footprint to a single return. For multi-client 3PLs, emissions should also be split by client and lane without manual work. Then that same shipment data can flow into packaging decisions in the next tool layer.
9. Packaging Optimization and Cartonization Tools
After routing and returns, packaging is the last chance to cut transport weight before a parcel leaves the dock. And that matters more than it may seem.
When you automate box selection at the packing station, cartonization tools help cut oversized boxes, excess void fill, and DIM charges. Even small changes in package dimensions can lower DIM charges and trim emissions at the same time.
Here’s how it works: the system pulls SKU weight and dimension data from the WMS, picks the smallest box that will still work, and sends that choice to the packing station in real time. That means packers aren’t guessing. They’re working from live data.
Every pound taken out of packaging reduces transport weight and emissions. Better trailer and container density also means lower emissions per shipment. Packaging reduction strategies typically cut freight emissions by 3% to 8%, and better load factors add another 1% to 2% reduction in total freight costs.
To make this work well, track SKU-level packaging weight and dimensions. That gives you primary data for transport emissions calculations and helps line up reporting with GLEC Framework v3.0 and ISO 14083. Using primary weight and dimension data instead of rough averages connects packaging to the full measure-reduce-report cycle. Without that level of detail, ESG and CSRD reporting gets weaker.
It also helps to connect cartonization software to your WMS, TMS, and parcel carrier APIs. Then box choice can support the lowest-cost or lowest-carbon service right at label creation. At that point, cartonization stops being a fixed packaging rule and becomes a live shipping decision.
One warning here: clean your weight and dimension data before launch. If the inputs are wrong, the system will be off from day one. And once that data is clean, it can feed the rest of a carbon-conscious 3PL stack.
Packaging is the final on-dock lever before emissions are locked into the shipment.
How JIT Transportation Fits into a Carbon-Conscious 3PL Stack
Those nine tools only work well if the shipment data going into them is clean and dependable. That’s where JIT Transportation comes in.
Because JIT handles both fulfillment and transportation, it can pass along shipment-level data like vehicle type, route distance, and fuel data. That gives the measure side of the stack a much better starting point, instead of leaning on industry averages that can skew CO2e by 30–50%.
ERP integration moves order, shipment, weight, origin, destination, and carrier data through WMS and TMS workflows. In plain English, that means teams can track carbon at the shipment level and use the same data for Scope 3 reporting. It also makes that data usable across calculators, scorecards, and dashboards.
On the reduce side, JIT’s nationwide footprint can support inventory placement closer to the end customer. Fewer miles per order usually means lower transport emissions before a calculator ever touches the shipment.
Kitting and assembly also help upstream. By improving cube utilization before products leave the warehouse, JIT helps create cleaner inputs for cartonization and load optimization tools. That same data then flows into TMS platforms and reporting dashboards with fewer gaps and fewer rough estimates.
Put simply, better upstream shipment inputs make every carbon tool in the stack more useful. Those inputs feed the calculators, TMS, routing, and reporting tools summarized below.
Quick Comparison Snapshot
These nine tool categories handle different parts of the job. Looking at them by function makes it easy to spot gaps in your stack and see which parts of the measure-reduce-report cycle you already have covered.
Measuring emissions comes first. Logistics emissions calculators and carbon-aware TMS platforms track shipment-level CO2e and pass that data into load planning. Once you can measure emissions, you can start cutting miles, fuel use, and load waste.
Reducing miles and fuel is where route optimization, network design, carrier scorecards, cartonization, and returns tools come in. They cut miles, improve load density, and help shift freight toward lower-emission options.
Controlling freight spend is the role of parcel audit and billing tools. They recover shipping costs and clean up the shipment data that carbon reporting depends on.
Reporting results falls to carbon reporting dashboards. These pull data from multiple nodes into audit-ready ESG reports. Once reporting is in place, the next thing to check is which tools also improve day-to-day shipment data.
Workflow coordination is where JIT Transportation keeps carrier tenders, tracking, and exceptions moving. At the same time, it feeds clean shipment data into calculators, scorecards, and dashboards. That data base is what helps the rest of the stack do its job.
Conclusion
No single tool makes a 3PL lower-carbon on its own. The win comes from a connected stack: measure emissions, optimize moves, pick lower-carbon carriers, and report the results.
The first investment should match your network shape. Long-haul lanes usually get the most from mode shift. Dense regional networks often see faster gains from routing and cartonization. Start with shipment-level data instead of generic averages. That gives you a much clearer picture of what’s happening and where the biggest gains sit.
Customer requirements matter too. If you serve enterprise customers with CSRD or SEC climate disclosure requirements, audit-ready reporting is a must. Tools that support multi-client emission allocation and white-labeled dashboards can help you keep those customer relationships strong as reporting demands grow.
This kind of stack only works well when the shipment data underneath it is clean. JIT Transportation supports that setup with ERP integration, distribution, fulfillment, and returns management that help keep shipment data clean. The best stack is the one that turns shipment data into lower emissions, lower cost, and audit-ready reporting.
FAQs
Which carbon tool should I implement first?
Start with a clear baseline for your current logistics-related carbon footprint. Run a sustainability audit to see where you're using the most energy, fuel, and packaging materials.
Next, make API integration a top priority between your ERP and your 3PL partner’s WMS and TMS. This gives you automated, shipment-level data for more accurate reporting. It also makes it easier to use sustainability dashboards to track KPIs like CO₂e per order.
How do I verify shipment-level CO2e accuracy?
Verify shipment-level CO2e accuracy by focusing on traceability and alignment with standards like the GLEC Framework and ISO 14083:2023. Keep audit trails that connect reported emissions back to source records, such as transport invoices, fuel records, and GPS-tracked route distances.
It also helps to check that your system uses carrier-specific emission factors, reconciles totals on a regular basis, and assigns clear ownership for each data set. Then compare your estimates with verified carrier figures so you can fine-tune internal emission factors over time.
Can these tools support client ESG reporting?
Yes. These tools support client ESG reporting by automating shipment-level data collection, including transport weight, distance, and fuel use.
When connected to your ERP, they replace manual spreadsheets with a more reliable flow of data. That helps you calculate emissions in line with recognized frameworks, produce audit-ready disclosures, track progress over time, and give investors and enterprise customers the transparency they expect.
Related Blog Posts
Related Articles

3PL Custom Packaging for E-commerce Orders
Real-Time Delivery Visibility for 3PL: Guide