Eco-Friendly Fulfillment for High-Growth Brands
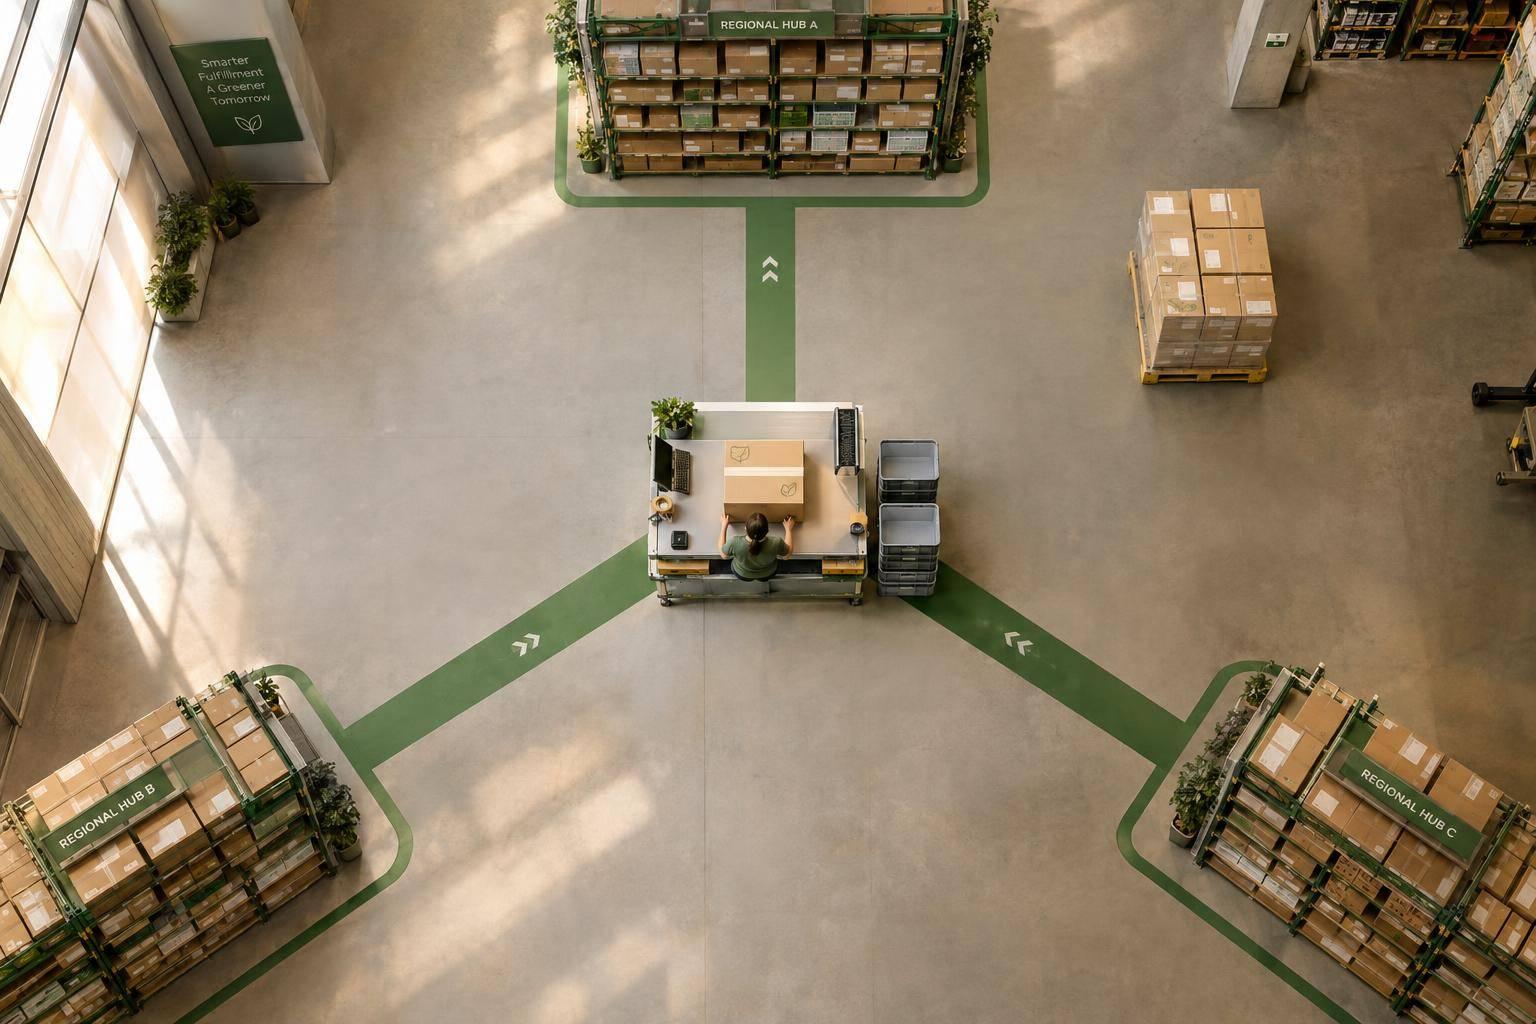
I’d start with one change that cuts waste without increasing damage or missing delivery dates. Test it against your current process, then compare total waste, emissions, cost per delivered order, labor, and customer experience - not just the packaging.
Here’s how I’d weigh the four options:
- Right-size packaging: Use less material and empty space, but check packing time and product protection.
- Stock inventory near demand: Shorten delivery routes, but account for added stock, warehouse work, and split shipments.
- Consolidate orders and freight: Send fewer shipments, but set clear hold limits and get consent before changing delivery dates.
- Reuse packaging and recover returns: Cut single-use waste and recover products, but count return shipping, inspections, cleaning, and losses.
For regional stocking, I’d start with an 8–12-week pilot using a small group of high-demand products. My rule for scaling any method: <u>total waste must fall</u> while costs, labor, and service stay within agreed limits. Less waste per order isn’t enough if growth pushes total waste up.

Eco-Friendly Fulfillment: Compare 4 Strategies
1. Right-Size Packaging
Waste and Emissions
Measure each SKU’s length, width, height, and weight in inches and pounds, including inserts and common bundles. Record fragility, orientation limits, and the clearance needed for protection.
Standard cartons are easy to stock but leave unused space. Matching SKUs to carton sizes reduces that space; custom boxes reduce it further. Use standard cartons when demand is unpredictable and custom cartons for repeatable, high-volume SKUs.
Lighter board and single-material packaging use less material, but damage and replacements can wipe out those savings. Material savings count only if packing speed and damage rates stay stable.
Total Cost
Look beyond the box price. Include cushioning, storage, packing labor, freight, testing, and replacements.
Standard cartons work well for slow-moving products or unpredictable demand. Custom cartons make sense for stable, high-volume SKUs when recurring savings cover tooling, minimum orders, and longer lead times. Model costs over 12 to 24 months. If you use on-demand packaging equipment, include capital, software, and maintenance costs, too.
Labor and Scaling
Start with the highest-volume SKUs and test two or three designs. Use scan prompts and pack-station diagrams to help workers choose the right carton.
Track packing seconds, errors, and replenishment work. Too many carton sizes can mean more walking and training. Keep standard cartons for low-volume SKUs, and update packaging specifications whenever products or inserts change.
Customer and Delivery Impact
Once you've checked cost and labor, test how the package holds up in transit and looks at the door. Test for drops, vibration, compression, and exposure to temperature or humidity. Use ISTA 3A-style parcel testing, then retest new samples before a shipping pilot.
Check damage, ease of opening, tamper evidence, and presentation. Give clear disposal instructions, such as flattening the box and checking local recycling rules. Don't assume the package can go into curbside recycling. Approve only designs that pass damage and presentation checks in pilot shipments.
sbb-itb-eafa320
2. Place Inventory Near Customer Demand
Waste and Emissions
Packaging cuts waste inside the box. Inventory placement cuts waste across the network by reducing wasted miles, packaging touches, and split orders.
Centralized inventory lowers overhead and safety stock, but it lengthens outbound routes. Regional stocking shortens those routes but adds transfers, facility energy use, and split shipments. A middle path is selective placement: stock predictable, high-volume products near customers and keep slow movers centralized. The question is whether shorter deliveries offset the added complexity.
Total Cost
Compare one-, two-, and three-warehouse scenarios at the same service level. Count facility rent and utilities, labor, technology, inventory carrying costs, safety stock, interfacility transfers, returns, and outbound freight.
Use at least 6–12 months of order history, including SKU-level demand by ZIP Code or region. Then rerun the scenarios with 5%–10% demand variation. Lower shipping costs help only if the added labor and inventory still fit the operation.
Labor and Scaling
One facility keeps training and supervision simpler. Each added location brings more receiving, picking, packing, cycle counting, workforce planning, carrier coordination, and systems integration.
Set local restock thresholds based on demand variability and lead times - not a single national rule. Track available, reserved, and inbound stock in real time. Consolidate replenishment loads so frequent transfers don’t eat up delivery savings.
Customer and Delivery Impact
Plan around the full order, not just the nearest warehouse. Assign inventory at the order level: a warehouse farther away may cut waste if it avoids a split shipment and still meets the delivery promise.
Reserve stock when assigning orders, and allow splits when waiting would miss that promise. Test a limited set of high-demand SKUs for 8–12 weeks before expanding. Track on-time delivery, stockouts, packages per order, shipping cost, and emissions against the centralized baseline.
3. Consolidate Orders and Freight
Once packaging and inventory placement are optimized, consolidation can cut the next layer of waste.
Waste and Emissions
Consolidation cuts waste only when orders or freight can travel together without missing the delivery promise. Two approaches help: parcel/pallet consolidation and route/schedule consolidation.
Parcel consolidation works best for the same customer or destination. Pallet and freight pooling work best for compatible lanes, fixed delivery days, or shared replenishment schedules. These methods can reduce shipment counts, route miles, handling touches, and emissions. But detours or extra handling can cancel out those gains.
Measure shipment count, damage, and emissions alongside the cost and service metrics below. The right choice depends on order compatibility, the promised date, and how much delay the customer will accept.
Total Cost
A lower freight rate doesn't always mean a lower delivery cost. Extra handling or expedited service to recover a missed deadline can wipe out the savings.
Compare freight savings against all related costs: parcel or pallet fees, fuel and residential surcharges, warehouse labor, staging space, software, tracking, inventory carrying costs, relabeling, damage, claims, split shipments, customer service, and any premium service recovery. Test both average and peak-season demand.
Labor and Scaling
Set eligibility rules for destination, service level, product compatibility, promised date, and customer consent. Set a maximum hold time, then release freight when the dispatch cutoff, hold limit, or fill target is reached.
Use marked staging areas and scan orders at packing, staging, handoff, and delivery. Keep each order traceable, even when cartons share a pallet.
Multi-zone orders may need to wait until all order lines arrive. That can reduce shipment waste, but it also requires more floor space, handling, and waiting time.
Customer and Delivery Impact
Once eligibility rules and hold times are set, customer communication becomes the deciding factor. Offer a standard consolidated option with a clear delivery window. Keep urgent and guaranteed services outside holding rules.
Get customer consent before combining orders or changing a selected delivery date. Never combine orders with incompatible promised dates.
Coordinated delivery windows can reduce failed delivery attempts and route miles. Still, customers may reject narrower windows or delayed dispatch.
Pilot one lane with a 12- or 24-hour hold limit and compare results against a four- to eight-week baseline. Track shipment count, freight cost per order, labor minutes, staging occupancy, on-time delivery, damage, emissions, and customer complaints - not freight savings alone.
4. Reuse Packaging and Recover Returns
Waste and Emissions
Once you’ve reduced outbound waste, focus on the packaging and products coming back. These follow two separate loops: packaging reuse and product recovery.
Packaging needs to complete enough trips to offset return, cleaning, and transport costs. Track recovery rates, successful reuse cycles, return miles, and cleaning inputs - not just durability. Single-use recyclable cartons still make sense when recovery is unlikely. Reusing cartons internally avoids a customer return trip, but costs still need to hold up as volume grows.
Total Cost
Compare cost per completed use. Include upfront packaging inventory, sorting, relabeling, return postage, inspection, cleaning, storage, losses, incentives, and collection.
Internal carton reuse saves the cost of a new carton. Take-back programs work best when packaging is durable, worth recovering, or hard to recycle locally. For returned products, refurbish only when expected resale value exceeds testing, repair, repackaging, and transportation costs.
Recovery and inspection also need to stay simple enough for teams to handle consistently.
Labor and Scaling
Start with one site, product category, or customer segment. Give each tote, mailer, or container its own ID. Record its shipment, return, inspection, cleaning, repair, and retirement status.
Approve reused cartons only when they’re clean, dry, intact, correctly sized, and free of old labels or hazard markings.
Track usable recovery rate: approved units ÷ units shipped, along with average successful reuse cycles. Grade returned products separately for resale, refurbishment, parts recovery, recycling, or disposal. Customer participation determines whether items make it back or become waste.
Customer and Delivery Impact
Print short return instructions inside the package. Add a QR code that links to a return label or drop-off location. Tell customers whether to fold, empty, or seal the item. Don’t ask them to wash it unless safety requirements call for it.
Simple, specific instructions help increase return rates and reduce contamination. Track participation, complaints, and damage.
Consolidate returns when practical, but never delay refunds to fill a load. Track packaging returns and product returns separately: recovering a mailer doesn’t mean the product was saved from disposal.
How the Methods Compare as Order Volume Grows
As order volume grows, each method cuts waste in different parts of fulfillment - and creates different bottlenecks.
Waste and Emissions
Look at the full fulfillment cycle, not just the box. Include replenishment, transfers, facility energy, staging, damage replacements, cleaning, and losses. Use EPA’s WARM only for planning, and keep modeled estimates separate from measured results.
Packaging that is technically recyclable may not be collected locally. Track packaging waste, shipping miles, and split shipments as volume grows.
Total Cost
Compare fully loaded cost per delivered order. Right-sizing cuts material use and dimensional-weight charges but adds equipment and maintenance costs. Nearby inventory reduces freight costs but adds storage and carrying costs. Consolidation adds staging and software, while reuse adds retrieval, cleaning, and losses.
Include labor, replenishment, damage, and returns. Test both normal and peak volumes rather than promising a fixed payback. At scale, labor and capacity often affect costs more than materials do.
Labor and Scaling
Each method moves work to a different bottleneck: packing, replenishment, staging, or inspection. Before expanding, check SKU dimensions, demand forecasts, inventory visibility, order rules, and site capacity.
Track labor minutes and peak-season capacity separately. Annual averages can hide crowded staging areas or inspection backlogs.
Service is the final test: a lower-waste method falls short if it misses delivery promises or makes the process harder for customers.
Customer and Delivery Impact
Right-sizing should protect products and make packaging easier to dispose of. Track damage rates as volume grows. Nearby inventory shortens delivery times only when it prevents split shipments.
Make consolidation opt-in or clearly state the delivery window. Customers need to understand that fewer packages may mean a later arrival.
Reuse works only when participation fits customers’ normal behavior. Dedicated return trips can erase lifecycle gains.
Strengths, Limits, and Best Uses
The best method depends on how stable your SKUs are, how demand is spread, and what service you promise.
Right-sizing: Works best for repeatable, high-volume SKUs with stable dimensions and low damage risk. Keep protective inserts for fragile items.
Regional stocking: Suits fast-moving SKUs with steady regional demand. Keep slow-moving, seasonal, or unpredictable items centralized, since duplicate safety stock adds carrying costs. For seasonal peaks, use temporary forward stock and account for the cost of moving unsold inventory back.
Consolidation: Fits predictable dispatches, such as wholesale replenishment and subscriptions. It falls short when freight schedules and promised delivery dates don’t line up.
Reuse: Works best for repeat-purchase or closed-loop programs. Inspection, cleaning, and lost units are the main burdens. Track packaging recovery separately from product recovery. Refurbishment or resale may still be worthwhile when collecting empty packaging isn’t.
Methods often work best in pairs. Combine methods around complete orders, not individual SKUs. Right-sizing and selective regional stocking can reduce both packaging waste and delivery distance.
Before allocating inventory, check which items customers buy together. Stock frequent pairings in the same location where demand supports it. Otherwise, separating a top seller from its usual companion can turn one order into two shipments. Before expanding, compare packages per order and the share of orders filled from one facility.
Conclusion: Test, Measure, and Scale
Before scaling these methods, measure results against a matched control. Test one change at a time within a defined SKU group, customer segment, fulfillment center, or region. Use the existing process as the control, matching product mix, destination zones, and delivery promises. Record a baseline, set success thresholds before launch, and review results weekly.
Track packaging, freight, service, labor, damage, and return metrics. Measure fully loaded cost per delivered order, not just freight. Include packaging, warehouse handling, transportation, inventory carrying costs, returns processing, and damage replacements.
Give closed-loop programs a separate scorecard. Track return rate, recovery rate, reuse cycles, and redeployment rate - the share of recovered packaging that gets reused. Include emissions from transfers and reverse transportation when reporting reuse results.
Scale only when waste drops, costs and labor needs stay acceptable, and damage, return, and delivery performance remain stable.
FAQs
Which fulfillment change should I prioritize with a limited budget?
Start with 30 to 60 days of shipping data. Use it to set right-size packaging rules in your warehouse management system. This cuts dimensional-weight charges and material waste without a major capital investment.
Move fast-moving items closer to pack stations, too. That can reduce travel time by up to 29%. These low-risk changes help control cost per order and keep operations steady before you take on more complex approaches, such as multi-node inventory placement.
How can I separate pilot results from seasonal demand changes?
Compare pilot results with a matched baseline across multiple billing cycles. Keep the test focused on one region or product family, and track total cost per delivered order. Include fulfillment, technology, and storage costs - not just postage.
At monthly reviews, check whether gains in parcel density and reductions in split shipments and damage rates hold after peak demand drops. Verify that savings repeat across billing cycles rather than come from temporary invoice credits or refunds.
How do I calculate the break-even point for reusable packaging?
Compare what you spend on single-use packaging with the reusable program’s total lifecycle costs. Include container purchases, reverse logistics, return freight, cleaning, inspection, and replacements for lost or damaged units. Factor in return rates and the number of reuse cycles.
Start with a 500- to 2,000-unit pilot to check loss rates and cycle times. You reach break-even when the reusable packaging’s cost per order drops below your single-use baseline.
Related Blog Posts
Related Articles

8 Ways 3PLs Handle Seasonal Workforce Swings

Marketplace API vs EDI for Fulfillment